Water Quality and Lake Health
Among the challenges facing the watershed, "P" is the greatest - how much phosphorus can Lake Winnipesaukee handle, and how does that level affect the health of our communities and our ecosystems?
Introduction Return to Top
While water resource professionals consider the overall water quality of Lake Winnipesaukee “good†and even “pristineâ€, indicators of water quality in the last 10 yrs show a downward or negative trend. Some of these indicators are the frequency in beach closings due to bacteria (e. coli), the increase in the spread of milfoil, the frequency and occurrence of algal blooms, some of which are of health concern due to cyanobacteria, and a decline in fish and loon populations.
One of the primary concerns of the Lake Winnipesaukee Watershed Management Plan is phosphorus loading from the land into the lake and its impact on lake water quality. One of the difficulties of discerning problems with excess P loading for Lake Winnipesaukee is that, due to its size and volume, in-lake effects of P loading like reduced clarity and algae blooms are slow to appear.
It is clear from data collected primarily by UNH LLMP that P levels are generally increasing lake-wide, and this should be cause for action. These long term trends are likely to continue unless cities and towns in the lake’s watershed act to adopt land use best management practices that reduce P loadings to the lake.
The Phosphorus Focus Return to Top
Although phosphorus (P) is not the only pollutant of concern affecting water quality, the State of New Hampshire Department of Environmental Services recently set nutrient criteria standards for acceptable levels of phosphorus in surface waters that would support the aquatic life designated use.
What does that mean?
Think of the lake as a stomach, it receives all the stormwater runoff from the land surrounding it, which contains metals, oil, road salt, sediment, nutrients, etc. Nutrients by definition are good; they provide needed food for growth or energy.

Schindler, 1973. Ontario, CA
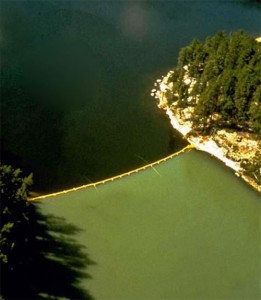
Experiment depicting results from adding C + N to one half of lake, C, N, and P to other half.
Then why is phosphorus considered a pollutant? Because as with most things, excessive amounts can have a negative impact. Under natural conditions (pre-development), the lake water does not contain an abundant supply of phosphorus. Due to that fact, phosphorus is considered the limiting nutrient in most New Hampshire fresh waters and a necessary nutrient for aquatic productivity.
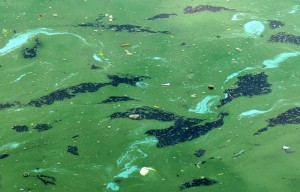
When excessive amounts of phosphorus enter the lake, it provides the food or energy needed to boost plant productivity, resulting in algal blooms. The lake, like a stomach, gets sick and turns green. The photo at right depicts the results from an experiment conducted by Schindler, 1973 on a lake in Ontario. Nitrogen and carbon were added to the section of the lake in the top of the photo; in the bottom section, phosphorus was added in addition to the nitrogen and carbon, proving phosphorus was the limiting nutrient.
Increased P levels in freshwater, along with other environmental conditions, may result in increased biological productivity, causing increased phytoplankton (algae) and cyanobacteria cell production in the water column. This in turn can cause:
- Decreased water clarity
- Increased Chlorophyll-a level
- Increased turbidity levels
- Accelerated lake eutrophication
- Decreased oxygen concentrations
- Undesirable shifts in relative abundance of aquatic species
Increased levels of P in freshwater may also result in:
- Decline in property values
- Economic loss from decline in tourism due to decline in water clarity
- Public health risk due to potential of increased occurrence of cyanobacteria blooms
- Decline in swimming, fishing and boating use
- Increase in public expenditures to address water quality impairments
- Increase in plant productivity
Phosphorus loading is accelerated through human activities in the watershed. Human and animal waste, residential and agricultural fertilizers, and atmospheric deposition are the major sources of P. P is found in organic and inorganic (“orthophosphateâ€) compounds. It is bound in soil by adhering to the surface of soil particles. Erosion and sediment transport, including eroding stream banks, roadway runoff, and exposed soil on construction sites are all potential phosphorus sources. High intensity rain events result in untreated stormwater transported from the land and the road network to storm drains and catch basins which discharge directly and indirectly to surface waters.
For more information on phosphorus and the State nutrient criteria, click here for a useful questions and answers paper. (PDF, 1.1mb)
Water Quality Return to Top
 Lake Winnipesaukee is currently categorized as oligotrophic (low productivity) and listed as a high quality water by the New Hampshire Department of Environmental Services (NH DES). The trophic status also takes into consideration dissolved oxygen concentration, chlorophyll-a (phytoplankton community abundance), submerged and emergent aquatic plant communities, and thermal stratification (Winnipesaukee stratifies during the summer and typically mixes completely in spring and fall).
Data on water quality of the lake has been collected for over 20 years through the University of New Hampshire’s Lakes Lay Monitoring Program (UNH LLMP). The LLMP program measures water clarity, temperature, phosphorus, chlorophyll-a, alkalinity, and dissolved color. However, not all areas of the lake have consistently been sampled, and therefore monitoring needs to expand and continue in all the sub-basin areas to assess current in-lake phosphorus concentrations.
Phosphorus water quality analyses (in-lake productivity) were conducted on data available from NHDES, UNH, PSU, Lake Winnipesaukee Association, and town records. The data were divided into two categories – historical data over 10 years old, and summer data collected within the last 10 years. Review of the data show that the phosphorus trend in Lake Winnipesaukee has increased (worsened) 1.1ppb in ten years.

State Standard for Phosphorus Return to Top
In New Hampshire, designated uses and the water quality to protect those uses are regulated through the Water Quality Standards, which include RSA 485-A:8 – the Classification of Water, and Env-Wq 1700 – the Surface Water Quality Regulations. RSA 485-A:8 establishes that all New Hampshire surface waters are classified as either Class A or Class B waters, and specifies certain minimum surface water quality criteria for each classification. The Surface Water Quality Regulations further protect and maintain New Hampshire’s waters through the identification of designated uses, antidegradation provisions, and additional numeric and narrative water quality criteria. The designated uses for New Hampshire waters are:
1. Aquatic Life
2. Fish and shellfish consumption
3. Drinking water supply
4. Primary and secondary contact recreation (swimming and boating)
5. Wildlife
In 2010, the State of New Hampshire set water quality standards for nutrients based on the aquatic life designated use of the water body. The total phosphorus and chlorophyll-a criteria for supporting aquatic life designated use are:
TP and Chl-a Criteria for Aquatic Life Designated Use
| Trophic State | TP (ug/L) | Chl-a(ug/L) |
|---|---|---|
| Oligotrophic | < 8.0 | < 3.3 |
| Mesotrophic | <= 12.0 | <= 5.0 |
| Eutrophic | <= 28 | <= 11 |
As mentioned above, Lake Winnipesaukee is categorized as oligotrophic. The new state standard for total phosphorus (TP) and chlorophyll-a (chl a) that would apply to determine if Lake Winnipesaukee is supporting the aquatic life designated use is < 8 ug/L TP and < 3.3 ug/L Chl-a. 
This standard means that if the lake median phosphorus level reaches above 8 ug/L, the lake would be considered impaired and must meet rigorous antidegradation requirements for any level of development to occur. For information regarding antidegradation provisions, refer to the NHDES Fact Sheet WD-WMB-23 “What is Antidegradation?” The existing averaged in-lake phosphorus concentration for Lake Winnipesaukee places the lake within 2 ug/L of reaching that threshold.
Although Lake Winnipesaukee is listed as one assessment unit, the eight sub-basins exhibit varying water quality, with Moultonborough Bay Inlet having the highest in-lake TP concentrations.

