Identification of Pollution Sources
Identification of pollution sources and causes that will need to be controlled to achieve the load reductions necessary to achieve water quality goals is a key process in plan development.
To assist the WWLSAC achieve the respective target goals, watershed and shoreline surveys were conducted to identify potential sources of pollution and sediment loading throughout the watershed. The information gathered from the surveys was used to estimate the pollutant loading from each source and to determine priority areas for implementing best management practices (BMPs).
Watershed Nonpoint Source Survey Return to Top
In April, 2014 trained technical staff from FB Environmental Associates and DK Water Resources Consulting spent two days documenting erosion on the roads, municipal properties, driveways, and stream crossings in the Waukewan and Winona watershed. Â Problems were identified and documented, solutions were recommended, and the costs of improvements were estimated. Â In addition to documenting erosion sites, staff obtained information on shoreline and stream bank erosion as well as gully dimensions at each site.
The primary purpose of the 2014 Lake Waukewan and Winona Lake Watershed NPS Survey was to:
- Identify and prioritize existing sources of polluted runoff, particularly soil erosion sites, within the watershed. The survey focused on investigating potential sources of erosion and runoff to all waterbodies in the Waukewan-Winona watershed.
- Raise public awareness (through this plan and other outreach conducted by LWA) about the connection between land use and water quality, and the impact of soil in the watershed.
- Provide the basis to obtain additional funds to assist in fixing identified erosion sites throughout the watershed.
- Use the information gathered as one component of a long-term lake protection strategy.
- Collect site information to model estimated pollutant load reductions for each source of NPS pollution to Lake Waukewan and Winona Lake.
The purpose of the survey was NOT to point fingers at landowners with documented problems, nor was it to seek enforcement action against landowners not in compliance with ordinances. Â It is the hope that through future projects, local lake associations and communities can work together with landowners to solve erosion problems on their property, or help them learn how best to accomplish solutions on their own.
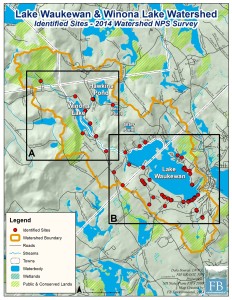
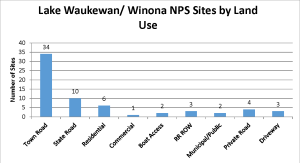
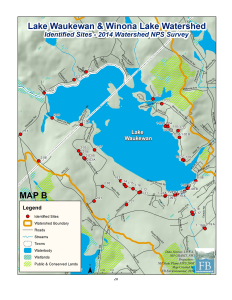
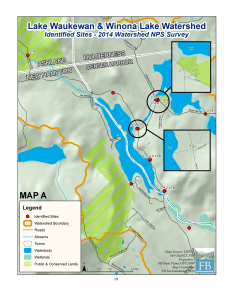
Volunteers and technical staff identified 65 sites in the Lake Waukewan and Winona Lake watershed that are currently impacting or have the potential to impact water quality in the lake. Â Some key conclusions include:
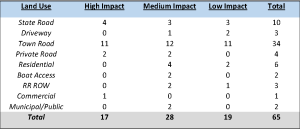
- 34 of the identified sites were documented on town roads. In total, there were 51 road-based sites (78%), including private roads, state roads and driveways; these sites generally have more severe problems, which in turn have a greater impact on the lake.
- Problems on residential land account for about 10% of all documented erosion sites. Residential sites are often less severe and less costly to fix. Additionally, landowner support and assistance can be instrumental in fixing these problems. Please note that additional residential sites were identified in the shoreline survey.
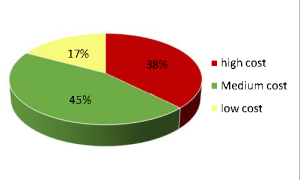
- The cost of fixing the sites was roughly estimated for all sites. 24(38%) of these sites are expected to incur a high cost (over $2,500). Â These high cost sites are commonly road and stream crossing sites. 29 sites (45%) are expected to have an associated cost ranging from $500-$2,500. Â These sites are mainly located on roadways, driveway sites and public areas. 11 sites (17%) will incur a low cost (under $500), and are primarily associated with slight surface erosion found at a variety of sites.
- Erosion sites were identified throughout the watersheds on a variety of different land uses. As such, everyone has a role to play in lake protection. Â The Towns of Meredith, New Hampton and Center Harbor, shorefront property owners, business owners, road associations, lakefront landowners and even people living farther from the lake can all take measures to reduce lake pollution.
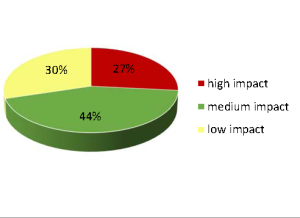
Each site was rated for its potential impact to waterbodies. Just under half of the surveyed sites were determined to have a medium impact on water quality. Impact is based on slope, soil type, amount of eroding soil, buffer size and proximity to water.
“Low†impact sites are those with limited transport of soil off-site with 30% of sites were rated low impact. “Medium†impact sites exhibit sediment transportation off-site, but the erosion does not reach high magnitude. 44% of sites were rated medium impact. “High†impact sites are those with large areas of significant erosion and direct flow to water. 27% of sites were rated high impact.
Recommendations were made for fixing each site, and the associated cost of labor and materials was estimated. Â Cost is an important factor in planning for restoration and the associated costs of BMP application.
“Low†costs sites were estimated to cost less than $500.  17% of sites were rated low cost.  An estimated cost between $500 and $2,500 was rated as “Medium.† 45% of sites were rated medium cost.  If the estimated cost was greater than $2,500, a “High†rating was assigned.  38% of sites were rated high cost.
Each evaluated site may be an isolated area of erosion, or connected to other sites as a cause or a result of stormwater runoff in adjacent areas. Â For example, runoff from a roadway may be eroding a nearby driveway. Â Runoff issues on one residential lot may affect a driveway nearby. Â The following section discusses the issues associated with NPS pollution identified for the three main land uses.
NPS Sites – Residential Areas
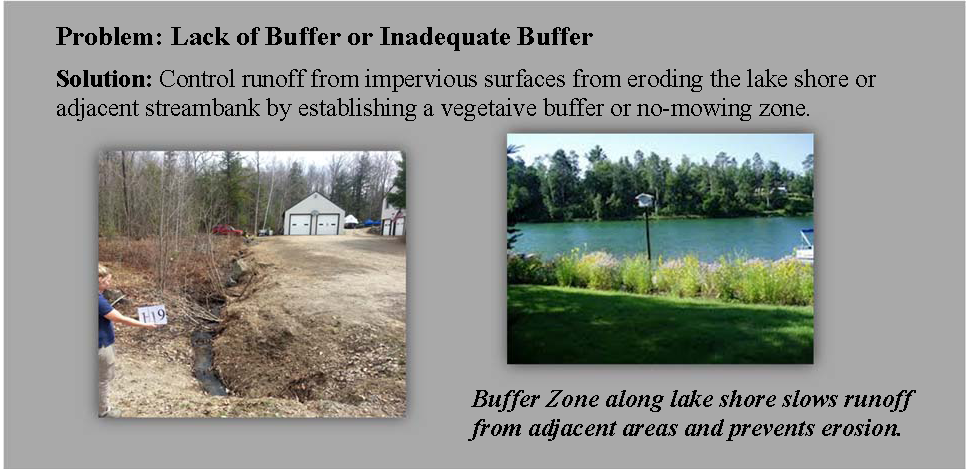
Residential areas accounted for about 10% of identified sources of polluted runoff.  Four of the six total residential sites were determined to be medium impact.  The remaining two sites were estimated to be low impact to the lake. Four of the sites were estimated as “medium†cost, and the remaining sites were assigned a “low†cost rating. The residential sites documented during the survey were often observed from road related sites and stream crossings. All of these sites were characterized as having buffer problems with an inadequate or non-existant buffer area between adjacent impervious surfaces and the streambank or shorefront. Below are examples of the most common problems seen at these sites, and recommended conservation practices to prevent soil erosion from affecting water quality in the lake.
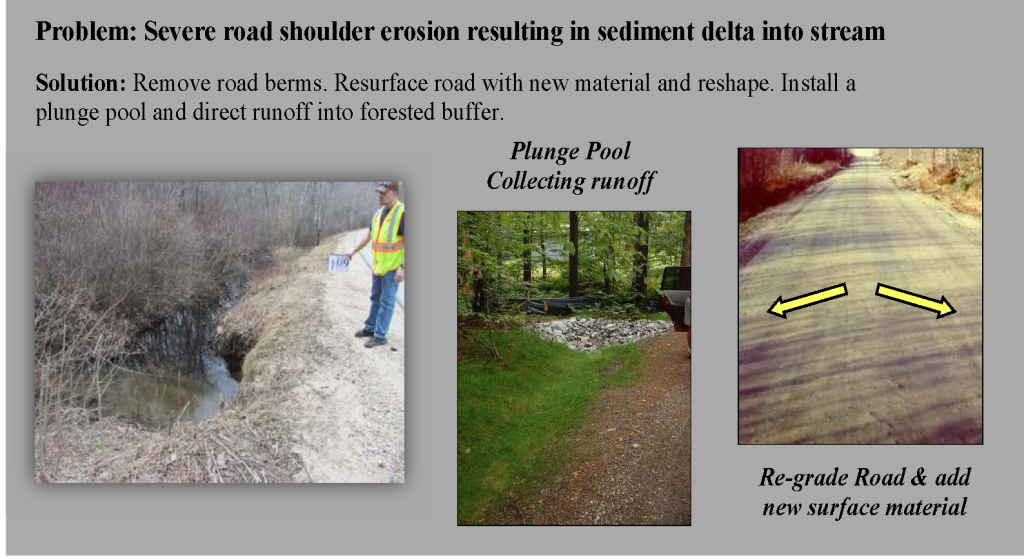
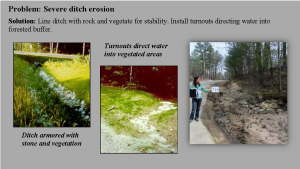
34 town road sites, 10 state road sites, and 4 private road sites were identified during the survey. These account for 73% of all surveyed sites. There were 17 high-impact sites, 17 medium-impact sites, and 14 low-impact sites. 19 of these sites were rated as medium cost, and 23 sites were determined to be high cost. The remaining 6 road sites were given a low cost rating. Road sites documented during the survey were often related to unstable or eroding culverts, road shoulder erosion, and ditch erosion. The following problems are examples of the most common road sites documented during the survey.
NPS Sites – Driveways
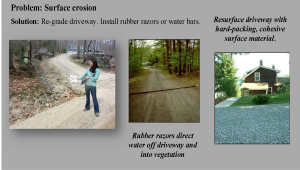
Three driveway sites were documented and represent 5% of all sites.  None of the sites were determined to be high impact. Two sites were assessed as low impact and one site was determined to be medium impact. No driveway sites were estimated to have high cost fixes. One site was estimated to cost between $500 and $2,500 (medium cost rating), and the other two sites were considered low cost (less than $500). The following example represents the most common driveway problem observed during the survey.
Fixing the NPS sites identified in this survey will require efforts by individuals, local lake and homeowner associations, road associations and municipal officials.
One approach to prioritizing erosion sites is to focus first on identifying sites rated high impact. Addressing problems at any of these sites would likely improve water quality at a moderate cost.  To further prioritize this list, sites with the highest likelihood of available funding, landowner participation, and/or community interest should also be identified.
It should also be noted that, although addressing high-impact sites is important, multiple low-impact erosion sites in one area can also have a negative impact on water quality and should be addressed.
Shoreline Survey Return to Top
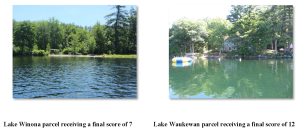
The Lake Waukewan and Lake Winona Shoreline Survey was conducted on Wednesday, July 11, 2014 by FB Environmental Associates (FBE) and several local watershed association volunteers. Two boats were utilized for surveying Lake Waukewan and one boat was used for Lake Winona. Staff and volunteers documented conditions of the lake shorelines by parcel using a scoring system that FBE has used previously for several lakes in ME and NH that evaluated vegetated buffer condition, appearance of bare soil, areas of shoreline erosion, the distance of structures to the lake, and the slope of the shoreline. Overall scores were given to each site based on these criteria. Photos were taken of each parcel evaluated; these photos have been cataloged by lake and site number and are stored on file at FBE and LWA. The photos will provide the project stakeholders with a valuable tool for assessing the lake shoreline conditions over time. It is recommended that a shoreline survey be conducted every 5 to 10 years to evaluate changing conditions. Ideally a re-survey should be conducted in mid-summer.
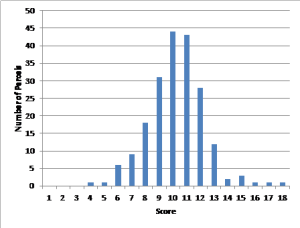
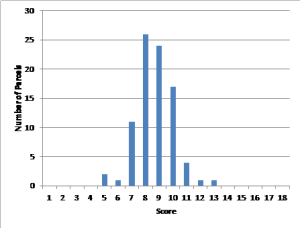
A total of 303 parcels were evaluated, of which 215 were located on Lake Waukewan and 88 on Lake Winona. Each parcel was given a score for different shoreline conditions that varied from one to five depending on the category (Buffer, Bare Soil, Shoreline Erosion, Distance, Slope).  Scores of 12 or more tend to indicate conditions that may be detrimental to lake water quality. Total scores could range from zero to eighteen. Shoreline conditions and overall scores were higher (slightly worse) on Lake Waukewan than Lake Winona.
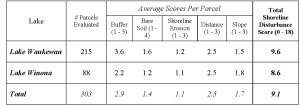
Average shoreline disturbance scores for each category evaluated, and the total average score for each lake. Lower values indicate shoreline conditions that are effective at reducing erosion and keeping excess nutrients out of the lake.
The overall average combined shoreline disturbance score of both lakes was 9.1. High scoring parcels on both lakes are those scoring a 10 or higher. These sites tended to have inadequate buffers, some evidence of bare soil, and structures within 75 feet of the shoreline. This trend tells us where the greatest improvements can be made around the lake shorelines, such as through planting stronger buffers and installing erosion controls. Although sites with good buffers, lack of shoreline erosion, and gradual slope conditions tended to score lower they should still be monitored for future changes and, if necessary, improvement.
The shoreline survey can be used to target future implementation efforts on residential shoreline properties. A recommended next step for the local lake associations is to locate property owners willing to “demonstrate†what an ideal shoreline buffer looks like and how it functions.
Data from both surveys will be used to inform the watershed plan and steps for improving the shoreline of these lakes. This includes highlighting areas contributing to non-point source pollution, determining actions needed to reduce NPS pollution and maintain water quality goals, as well as prioritizing areas for shoreline restoration using stormwater Best Management Practices (BMPs).
Prioritization of Mitigation Projects Return to Top
Malfunctioning septic systems, beach erosion, inadequate shoreline buffers, poorly maintained roads, winter sand inputs, and boat traffic all contribute to the current state of the water quality in Lake Waukewan and Lake Winona. The watershed survey conducted in April 2014 documented more than 60 issues persisting today within the watershed contributing sediment and other pollutants to various waterbodies throughout the watershed. The Lake Winnipesaukee Association and the Waukewan and Winona Lake Study Advisory Committee have begun the task of educating residents about the potential adverse effects of soil erosion and phosphorus as part of the watershed planning process and through recent projects.
By modeling results of pollutant reductions expected from addressing the 65 identified sites, we can estimate the total P load currently contributed by these selected locations throughout the watershed. Currently, 249.9 pounds of P enter Lake Waukewan and Winona Lake annually from these areas. Ideally, if all 65 problem sites identified in the 2014 watershed survey were treated with Best Management Practices (BMPs), and all new development contained proper phosphorus controls, these annual TP loadings would be significantly reduced, even in the face of growing development.
The EPA Region 5 Model was used to calculate the reduction in pollutant load in response to the implementation of BMPs in the Lake Waukewan and Winona watershed. The Region 5 Model provides a gross estimate of sediment and nutrient load reductions from the implementation of agricultural and urban BMPs. While it is recognized that this system has limitations, it does provide a uniform system of estimating relative pollutant loads.
During the watershed survey, measurements were collected at each identified site. The measurements document the area of any observed surface erosion or exposed/bare soil, the average dimensions of any gully erosion observed at each site (depth, width and length), and the height and lengths of eroded streambanks observed during the survey. These measurements are used as inputs in the Region 5 Model to calculate the reduction in pollutant load expected if these eroded areas were addressed by installing the recommended BMP.
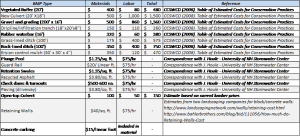
Technical staff conducting the watershed survey also made in-field recommendations for each identified site in the watershed. Based on these recommendations, FBE was able to provide estimates of cost for each recommended BMP. Cost estimates were based roughly on the table below:
Estimates were also provided for annual maintenance cost for each BMP. The initial cost of the BMP was combined with the annual cost of each BMP over a ten-year period (initial cost + (annual maintenance cost x 10 yrs)) to calculate a 10-year BMP cost for each site. This 10-year cost estimate was then used to determine the 10-year cost per lb and per kg of phosphorus removed by each BMP per year.
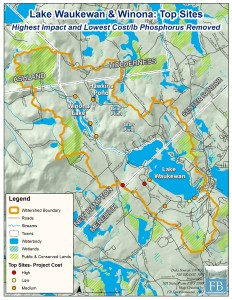
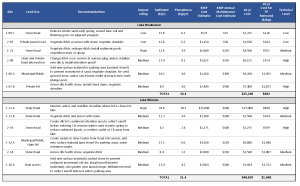
All surveyed sites were prioritized by two factors. First, priority was given to sites assessed as having a higher environmental impact to water quality. Second, sites were then sorted by cost per lb. of phosphorus removed by the recommended BMP each year. The resulting prioritized list for each lake’s watershed can be found here and in Appendix E.
The top six BMP sites from the prioritized list of all identified survey sites for each of the Lake Waukewan and Lake Winona watersheds would remove 84.8 kg of phosphorus per year from entering either Lake Waukewan or Winona. This would account for 75 % of the total estimated P load per year contributed by all surveyed problem areas. On average, the top 12 BMPs will have an estimated 10-year cost of $874 per kilogram of phosphorus removed.

