
Assessment of Water Quality
MBI Inlet has historically exhibited excessive levels of in-lake total phosphorus (TP) compared to the other seven sub-basins which comprise Lake Winnipesaukee.
- Applicable Water Quality Standards and Criteria
- Watershed Modeling
- Establishment of Water Quality Goals
This section provides an overview of the water quality standards that apply to MBI, the methodology used to assess water quality, and recommendations for managing this waterbody to prevent future decline in water quality. MBI is part of a larger lake system, Lake Winnipesaukee, and thus, the Inlet itself is not listed as a separate assessment unit by NHDES, but is integrated with and classified the same (oligotrophic) as Lake Winnipesaukee, which is listed on the 2014 DRAFT NHDES 303(d) list as impaired for aquatic life based on the presence of cyanobacteria. Other waterbodies within the MBI watershed that are listed as impaired for aquatic life on the 2014 DRAFT NHDES 303(d) list include Garland Pond (based on elevated chlorophyll-a (Chl-a), low dissolved oxygen (DO), elevated total phosphorus (TP), and low pH) and Weed Brook (based on non-support for macroinvertebrates and low pH). Dinsmore Pond, Meadow Brook Pond, Lees Pond, Halfway Brook, and Shannon Brook are also listed as impaired for aquatic life based on low pH.
This plan focuses on phosphorus as the overall driver of ecosystem health. Waterbodies with excess nutrients, particularly phosphorus, which is considered the limiting nutrient in freshwater systems, are overproductive and may experience symptoms of water quality decline, including algal blooms, fish kills, decreased water clarity, loss of aesthetic values, and beach closures. Decomposition of accumulated organic matter from dead algal blooms and plants, such as milfoil, can result in anoxia in bottom waters, which can release phosphorus back into the water column as food for algae and plants and can also be lethal to fish and other aquatic organisms.
3.1 APPLICABLE WATER QUALITY STANDARDS AND CRITERIA Return to Top
 The State of New Hampshire is required to follow federal regulations under the CLEAN WATER ACT (CWA) with some flexibility as to how those regulations are enacted. The main components of water quality regulations include designated uses, water quality criteria, and antidegradation provisions. The Federal CWA, the NH RSA 485-A Water Pollution and Waste Control, and the NH Surface Water Quality Regulations (Env-Wq 1700) are the regulatory bases for governing water quality protection in New Hampshire. These regulations form the basis for New Hampshire’s regulatory and permitting programs related to surface water. States are required to submit biennial water quality status reports to Congress via the USEPA. The reports provide an inventory of all waters assessed by the State and indicate which waterbodies exceed the State’s water quality standards. These reports are commonly referred to as the “Section 303(d) list†and the “Section 305(b) reportâ€.
3.1.1Â Designated Uses & Water Quality Classification
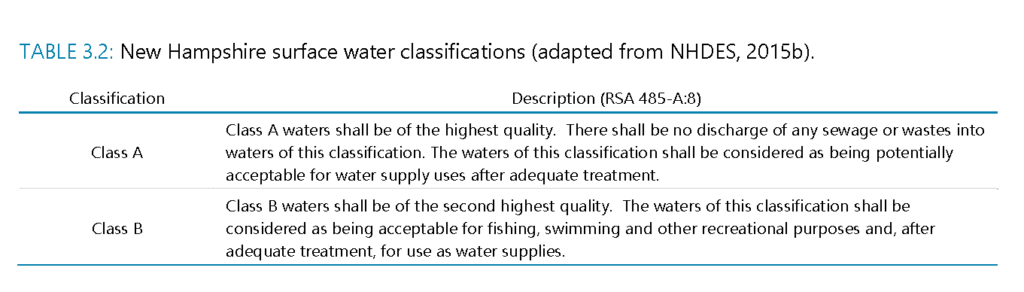
The CWA requires states to determine designated uses for all surface waters within the state’s jurisdiction. Designated uses are the desirable activities and services that surface waters should be able to support, and include uses for aquatic life, fish consumption, shellfish consumption, drinking water supply, primary contact recreation (swimming), secondary contact recreation (boating and fishing), and wildlife (Table 3-1). Surface waters can have multiple designated uses. In New Hampshire, all surface waters are also legislatively classified as Class A or Class B, most of which are Class B (Env-Wq 1700). A brief description of these classes is provided in Table 3-2 (NHDES, 2014a). MBI, as part of Lake Winnipesaukee, is classified as Class B waters in the State of New Hampshire. Water quality criteria are then developed to protect these designated uses. Depending on the designated use and type of waterbody, water quality criteria can become more or less strict if the waterbody is classified as either Class A or B. Water quality criteria for lakes are discussed in Section 3.1.3.

 3.1.2Â Lake Nutrient Criteria
New Hampshire’s water quality criteria provide a baseline measure of water quality that surface waters must meet to support their designated uses. These criteria are the “yardstick†for identifying water quality problems and for determining the effectiveness of state regulatory pollution control and prevention programs. If the existing water quality meets or is better than the water quality criteria, the waterbody supports its designated use(s). If the waterbody does not meet water quality criteria, then it is considered impaired for its designated use(s).
 Water quality criteria for each classification and designated use in New Hampshire can be found in RSA 485 A:8, IV and in the State’s surface water quality regulations (NHDES, 2008). Aquatic Life Use (ALU) and Primary Contact Recreation (PCR) are the two major uses of concern for MBI.
AQUATIC LIFE USE
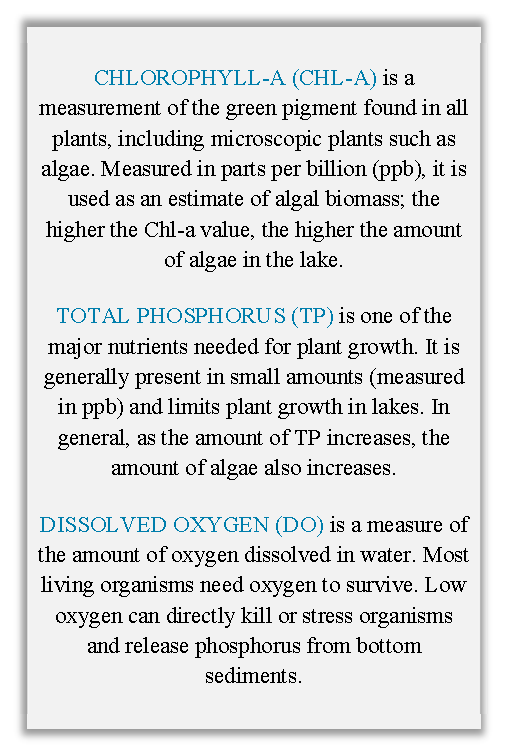
Criteria for ALU ensure that waters provide suitable habitat for the survival and reproduction of desirable fish, shellfish, and other aquatic organisms. For ALU assessment, the State has narrative nutrient criteria with a numeric translator or threshold, consisting of a “nutrient indicator†or TOTAL PHOSPHORUS (TP) and a “response indicator†or CHLOROPHYLL-A (CHL-A) (see also: Env-Wq 1703.03, Env-Wq 1703.04, Env-Wq 1703.14, and Env-Wq 1703.19).
The nutrient and response indicators are intricately linked since increased TP loading frequently results in increased algae, which can be estimated by measuring Chl-a levels in the lake. Increased algae may lead to decreased DISSOLVED OXYGEN (DO) at the bottom of the lake, decreased water clarity, and possibly changes in aquatic species composition.
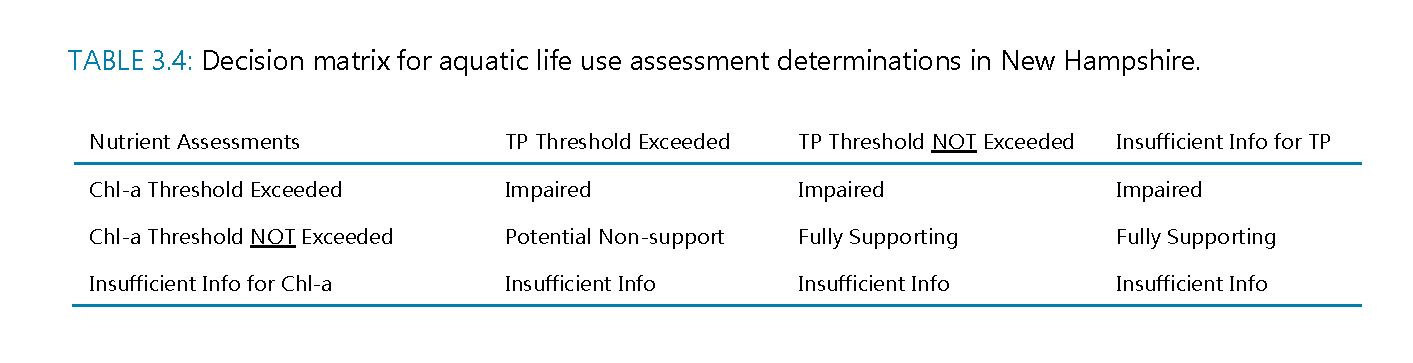
 As shown in Table 3-3, ALU criteria vary by lake TROPHIC STATE, since each trophic state has a certain algal biomass (Chl-a) that represents a balanced, integrated, and adaptive community. Exceedances of the Chl-a criterion suggests that the algal community is out of balance. Since phosphorus is the primary limiting nutrient for growth of freshwater algae (Chl-a), phosphorus is included in this assessment process. For ALU assessment, TP and Chl-a are combined per the decision matrix presented in Table 3-4. The Chl-a concentration will dictate the assessment if both Chl-a and TP data are available and the assessments differ.
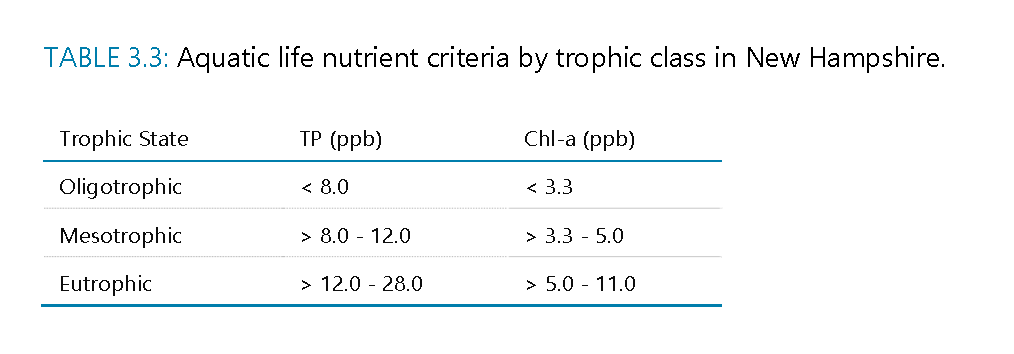
From 1974 through 2010, NHDES conducted trophic surveys on lakes to determine TROPHIC STATE. The trophic surveys evaluated physical lake features, as well as chemical and biological indicators. Trophic state is designated as: oligotrophic, mesotrophic, or eutrophic. These are broad categories used to describe how productive a lake is. Generally, oligotrophic lakes are less productive or have less nutrients (i.e., low levels of TP and Chl-a), deep SECCHI DISK TRANSPARENCY (SDT) readings (8.0 m or greater), and high DO levels throughout the water column. In contrast, eutrophic lakes have more nutrients and are therefore more productive and exhibit algal blooms more frequently than oligotrophic lakes. Mesotrophic lakes fall in-between with an intermediate level of productivity. MBI is designated as oligotrophic as part of the Lake Winnipesaukee assessment unit.
PRIMARY CONTACT RECREATION
For PCR, New Hampshire has a narrative criterion with a numeric translator or threshold for the primary indicator E.coli. The narrative criteria for PCR (Env-Wq 1703.03) states that “All surface waters shall be free from substances in kind or quantity which float as foam, debris, scum or other visible substances, produce odor, color, taste or turbidity which is not naturally occurring and would render it unsuitable for its designated uses or would interfere with recreation activities.†Nutrient response indicators, Chl-a and cyanobacteria scums, are used as secondary indicators. Elevated Chl-a levels or the presence of cyanobacteria scums interfere with the aesthetic enjoyment of swimming and/or may pose a health hazard. Chl-a levels greater than or equal to 15 ppb or the presence of cyanobacteria scums are considered “not supporting†for PCR. These secondary indicators can provide reasonable evidence to classify PCR as “not supporting,†but cannot result in a “fully supporting†designation.
3.1.3 ANTIDEGRADATION PROVISIONS
The Antidegradation Provision (Env-Wq 1708) in New Hampshire’s water quality regulations serves to protect or improve the quality of the State’s waters. The provision outlines limitations or reductions for future pollutant loading. Certain development projects (e.g., projects that require Alteration of Terrain Permit or 401 Water Quality Certification) may be subject to an Antidegradation Review to ensure compliance with the State’s water quality regulations. The Antidegradation Provision is often invoked during the permit review process for projects adjacent to waters that are designated impaired, high quality, or outstanding resource waters. While NHDES has not formally designated high quality waters, unimpaired waters are treated as high quality with respect to issuance of water quality certificates. Antidegradation requires that a permitted activity cannot use more than 20% of the remaining assimilative capacity of a high quality water. This is on a parameter-by-parameter basis. For impaired waters, antidegradation requires that permitted activities discharge no additional loading of the impaired parameter.
3.2 WATERSHED MODELING Return to Top
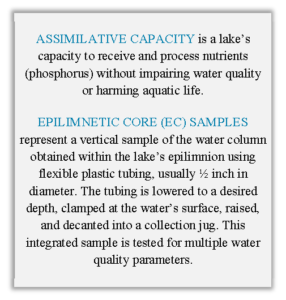 A lake receives natural inputs of phosphorus in the form of runoff from its watershed. This phosphorus will be taken up by aquatic life within the lake, settle in the bottom sediments, or flow out of the lake to downstream waterbodies. In this sense, there is a natural balance between the amount of phosphorus flowing in and out of a lake system, also known as the ability of a lake to “assimilate†phosphorus. The ASSIMILATIVE CAPACITY is based on factors such as lake volume, watershed area, and precipitation runoff coefficient. If a lake is receiving more phosphorus from the watershed than it can assimilate, then its water quality will decline over time as algal blooms become more frequent.
3.2.1Â Study Design and Data Acquisition
Historical water quality monitoring data was analyzed by LWA and FB Environmental to determine the median phosphorus value and the assimilative capacity for MBI. The New Hampshire Lake Survey Program and Volunteer Lake Assessment Program (VLAP) and the New Hampshire Lakes Lay Monitoring Program (LLMP) are the primary groups collecting water quality data from the Inlet, ponds, and streams in the MBI watershed. The LLMP is administered jointly by the UNH Center for Freshwater Biology (CFB) and UNH Cooperative Extension (UNHCE). All NHDES and UNH data are available through the NHDES Environmental Monitoring Database (EMD).
Data acquisition and analysis for MBI followed protocols set forth in the Site Specific Project Plan (SSPP; refer to Appendix A). Water quality data were combined into a common spreadsheet and then sorted by date and station for Quality Assurance/Quality Control (QA/QC) to avoid duplicating data sets. All duplicates were removed. Median in-lake TP was calculated for each station based only on EPILIMNETIC CORE (EC) and seasonal (May 24-September 15) samples. The seasonal (May 24-September 15) median EC TP value represents the ‘Existing Median Water Quality’ applied to the NHDES Assimilative Capacity Analysis for determining if a waterbody is Impaired, Tier 1, or Tier 2. See Figure 3-1 in the 2014 Consolidated Assessment and Listing Methodology for a conceptual diagram of Tier 1 and Tier 2 waters (NHDES, 2015b; NHDES, 2010). Due to the limited dataset (i.e., less than 10 years of data for all stations), Mann-Kendall trend tests could not be performed to examine trends over time (improving, degrading, or stable) for TP in MBI.
The Moultonborough Bay Inlet (MBI) represents a unique system for study because it is not a true lake, but rather part of a larger lake system (Lake Winnipesaukee). The morphology (shape) and bathymetry (depth) of MBI is fairly irregular, causing the formation of individual basins, bays, or inlets within the study system that impact water and nutrient movement (flushing), and subsequently, system function and health. Given these characteristics of MBI, the Inlet was divided into three individual basins (Basin 1, 2, and 3) for modeling, data analysis, and goal setting purposes. One of the challenges posed by this division is the lack of consistent, long-term data for each of the three basins. The number of sites and frequency of sampling in MBI has varied over the 20-year period with more consistent sampling occurring in the last 5 years. A summary of sampling site data is provided in Table 3.5. Refer to Appendix B for a map of monitoring station locations.

For Basin 1, WMO00GL (Green’s Basin) has been sampled regularly since 2010 (n=22); therefore, the dataset was assumed to be a good representation of current water quality conditions. For Basin 2, WMO01BL (Blanchard’s Island) was only sampled twice in 2011. More data will be needed to better inform the LLRM, assimilative capacity, and goals for Basin 2. The plan will include interim goals and milestones to reassess Basin 2 following several years (at least 5 years) of regular data collection. For Basin 3, there are multiple sites that have been monitored for total phosphorus (TP) at varying frequencies: WMOLEML (Lees Mills), WMOSTLL (State’s Landing), WMO01LL (Little Ganzy), WMO0SSL (Suissevale), and WMO10AL (Black Point). These sites vary in depth (since there is no true deep spot) and spatial distribution across Basin 3, suggesting that these sites experience different flow patterns and inputs from the corresponding drainage area to each site. Despite this, no statistically-significant difference (α<0.05) in TP data were found among Basin 3 sites, though accounting for the heteroscedasticity in the sample size data among sites using Welch’s ANOVA ensures sensitivity to Type I (false positive) errors (Table 3.5).
Given the lower TP concentrations measured at WMO0SSL (Suissevale) and WMO10AL (Black Point) and the proximity of these sites to the southern outlet of MBI, it is very likely that these sites are influenced by mixing with the larger Lake Winnipesaukee system, and therefore, may not be representative of inputs from the MBI watershed. It is recommended that a single, representative station be established for Basin 3 at WMO01LL (Little Ganzy). This station is deep (50 ft) and centrally-situated within the basin, so that a good portion of watershed inputs is accounted for and the station is located above the two lower stations where mixing from Lake Winnipesaukee may be an issue. Despite WMO01LL (Little Ganzy) being only sampled four times from 2010-11, the median TP is in good agreement with nearby sites: WMOSTLL (State’s Landing) upstream along the east shoreline of MBI and WMO0SSL (Suissevale) downstream in an area likely diluted by mixing with Lake Winnipesaukee. Therefore, WMO01LL (Little Ganzy) was used for the assimilative capacity analysis and goal with the intention that these values be updated and checked after more data are collected. The plan will include interim goals and milestones to reassess Basin 3 following several years (at least 5 years) of regular data collection.
3.2.2Â Assimilative Capacity Analysis
As stated previously, the assimilative capacity of a lake is its ability to resist the effects of landscape disturbance without water quality impairment. For purposes of this plan, phosphorus was determined to have the greatest direct impact on water quality in MBI. The median TP concentration for each basin was used to calculate the total, reserve, and remaining assimilative capacity using procedures described in the 2014 Section 305(b) and 303(d) Consolidated Assessment and Listing Methodology for New Hampshire (Table 3.6; NHDES, 2015b). Tier 2 waters, or high quality waterbodies, have one or more water quality parameters that are better than the water quality standard and that also exhibit a reserve capacity of at least 10% of the waterbodies’ total assimilative capacity. Tier 2 waters have some assimilative capacity remaining, whereas Tier 1 and Impaired Waters do not.
MBI shares Lake Winnipesaukee’s oligotrophic classification, which forms the basis for MBI’s assimilative capacity analysis and subsequent water quality goals. For oligotrophic waterbodies, the water quality criteria are set at 8 ppb TP and 3.3 ppb chlorophyll-a (Chl-a). NHDES requires 10% of the criteria be kept in reserve; therefore, median TP and Chl-a must be at or below 7.2 ppb TP and 3.0 ppb Chl-a, respectively, to achieve Tier 2 High Quality Water status. Support determinations are based on the nutrient stressor (TP) and response indicator (Chl-a), with Chl-a dictating the assessment if both Chl-a and TP data are available and the assessments differ.
For MBI, Basin 1 is considered impaired for both TP and Chl-a, while Basins 2 and 3 are potential non-supports due to insufficient, but likely lower than reserve capacity, Chl-a data (Table 3.6). The analysis revealed that Basin 1 requires the most reductions in TP and is at most risk for elevated nutrient input and algal blooms that can impact Basin 2 (and Basin 3 minimally), while Basins 2 and 3 may also have considerable reductions needed for TP if Chl-a levels are in fact a significant issue. However, data from multiple sites within Basin 3 show that Chl-a is better than the criterion (3.3 ppb) and reserve capacity threshold (3.0 ppb) for oligotrophic systems. Until more Chl-a data are collected for Basin 2 and 3 sites, the water quality goal will be based on the achievement of 7.2 ppb for TP with the understanding that this goal may change given the likely acceptable Chl-a levels in MBI.

3.2.3Â Lake Loading Response Model Results
A second analysis was used to link watershed loading conditions with in-lake TP and Chl-a concentrations to predict past, current, and future water quality in MBI (FBE, 2016a). An Excel-based model, known as the Lake Loading Response Model (LLRM), was used to develop a water and phosphorus loading budget for the Inlet and its tributaries. Water and phosphorus loads (in the form of mass and concentration) are traced from various sources in the watershed, through tributary basins, and into the Inlet. The model incorporates data about land cover, watershed boundaries, point sources, septic systems, waterfowl, rainfall, and an estimate of internal lake loading, combined with many coefficients and equations from scientific literature on lakes and nutrient cycles.
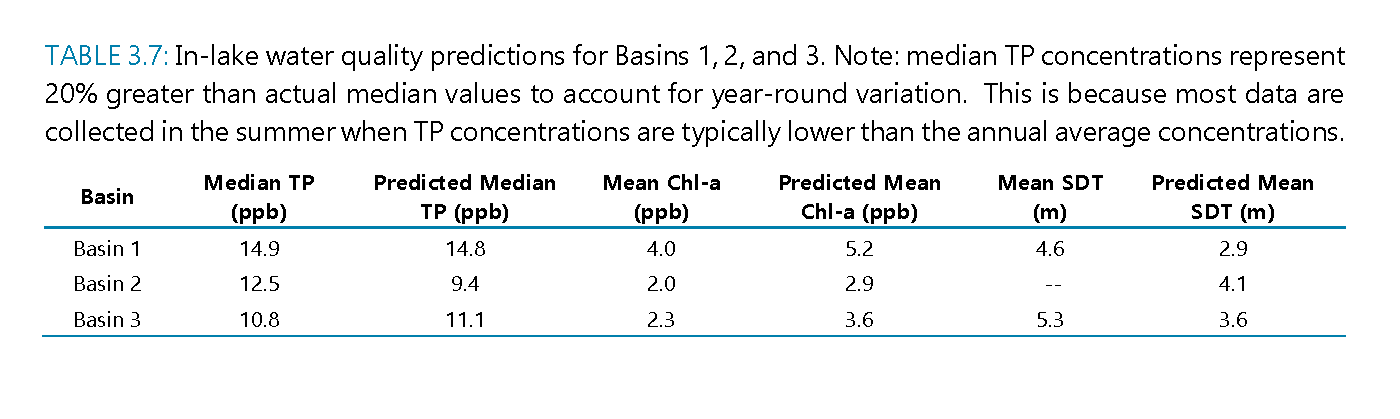
Basin 1 model was calibrated to WMO00GL (Green’s Basin) data; Basin 2 model was calibrated to WMO01BL (Blanchard’s Island) data; and Basin 3 was calibrated to the median of WMO10AL (Black Point), WMO01LL (Little Ganzy), WMO0SSL (Suissevale), WMOLEML (Lees Mills), and WMOSTLL (State’s Landing) data. Although we recommend the water quality goal be based on a single, representative station, an aggregate of station data was used for input to the model to ensure robustness of model calibration. The difference between methods is relatively small (summer median TP of 9.0 ppb for aggregated sites and summer median TP of 9.6 ppb for WMO01LL (Little Ganzy)). These data also reflect all existing data (regardless of season or year up to 2014) since the model takes into account year-round median TP, which is typically higher than summer median TP. Therefore, the existing median TP shown in Table 3.7 reflects all data median TP (2005-2014) available multiplied by a factor of 1.2 (assuming actual annual TP is 20% higher than summer TP).
The model predicted within 3% difference of observed median TP for Basins 1 and 3 (Table 3.7). We left a 28% difference between modeled and observed in-lake TP concentrations for Basin 2 due to the lack of data (n=2) for the Blanchard’s Island station. The median in-lake TP concentration of 12.5 ppb may not be representative of the basin. Without a more robust dataset, it is difficult to calibrate the model. Attenuation factors that were appropriate for other similar tributaries with data were used consistently and no further calibration was done for Basin 2. Interestingly, despite the model predicting variable (low or high) median TP concentrations compared to observation data, the model consistently predicted higher-than-observed Chl-a concentrations and lower-than-observed mean water clarity (Table 3.7). This suggests that other factors aside from phosphorus may be controlling observed water quality (i.e., the general empirical equations used in the LLRM do not fully account for all the biogeochemical processes occurring within the Inlet that contribute to the overall water quality condition).
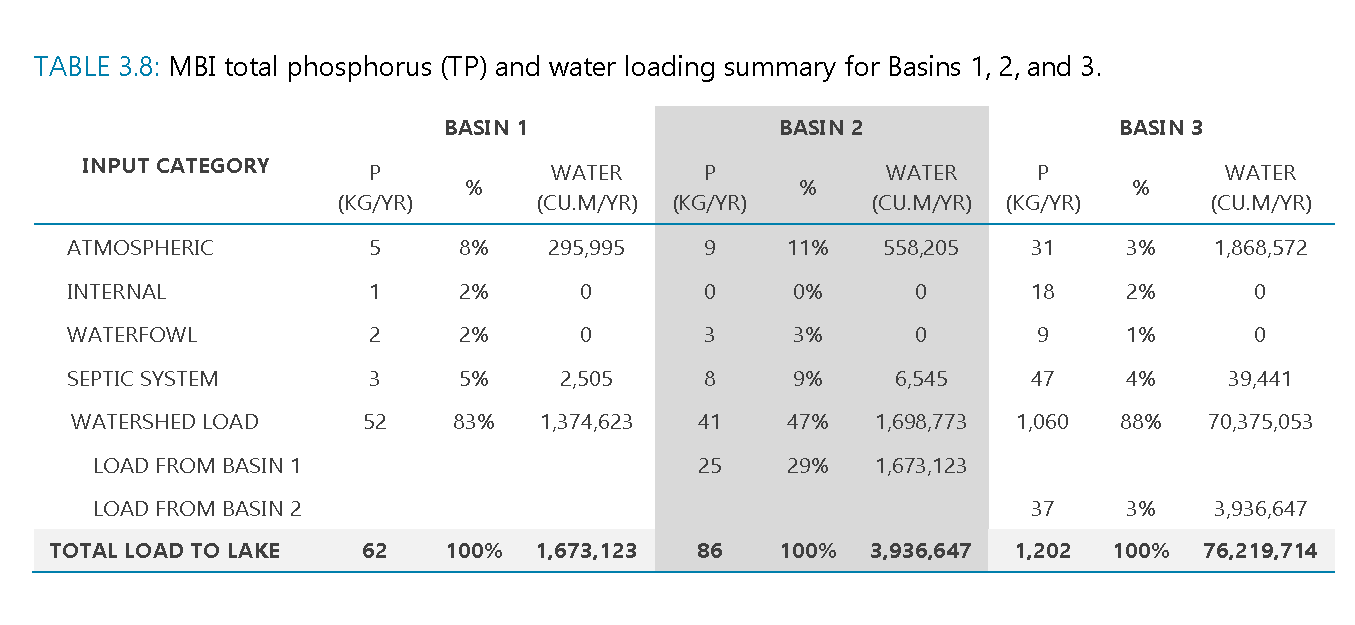
 As shown in Table 3.8, the results of this model indicate that the greatest phosphorus load comes from watershed runoff, which accounts for 83%, 47%, and 88% of the total loading to Basins 1, 2, and 3, respectively. Atmospheric deposition accounts for <11%, septic systems <10%, waterfowl <3%, and internal loading <2% of the TP entering the three basins. While the load from Basin 1 to Basin 2 accounts for 29% of the total load to Basin 2, the load from Basin 2 and Basin 3 accounts for only 3% of the total load to Basin 3. This suggests that the higher TP concentrations observed at Green’s Basin, while important locally, may not have a large impact further downstream.
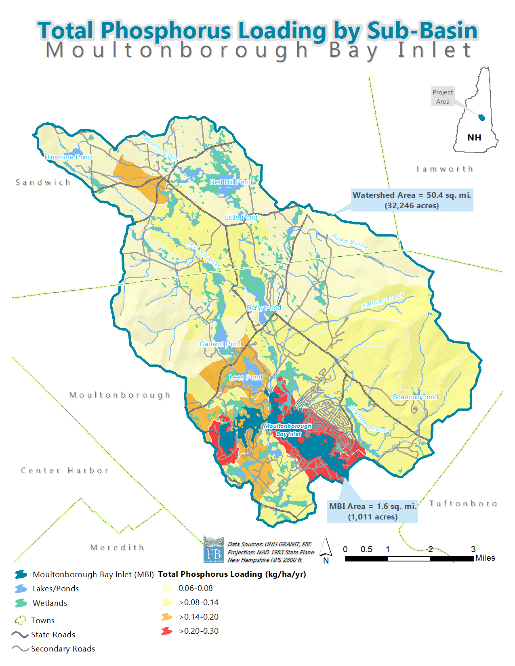
The direct drainage area of MBI contributes the most phosphorus per hectare per year compared to the other sub-basins (see Appendix B for larger map).
Examining the phosphorus concentration and attenuation factors for each contributing sub-basin to MBI is important for nutrient management. Based on high phosphorus concentrations and low attenuation, the model determined that the direct drainage area of MBI contributes the most phosphorus per hectare per year of any of the other sub-basins. The phosphorus load to MBI is much lower for sub-basins in forested headwater areas and higher for sub-basins in developed areas. Although developed areas cover only 11% of the watershed, these areas are contributing 88% of the phosphorus load to MBI (Figure 3.1).
A brief sensitivity analysis was performed per the request of the Advisory Committee. Three scenarios were selected and analyzed for percentage change in total phosphorus load to Basin 3 of MBI. If all septic systems were older systems (>25 years) and used year-round (assuming we are underestimating the septic system load), the TP load would increase by 5.3%. If the direct drainage area was unbuffered with no infiltration capacity (keeping current development coverage and assuming we are underestimating direct drainage load), the TP load would increase by 3.8%. If the TP load from Basin 2 to Basin 3 increased to the predicted full build-out concentration of 14.5 ppb (assuming we are underestimating current Basin 2 load), the TP load would increase by 1.7% A more detailed discussion of watershed modeling results with a breakdown of loading by subwatershed can be found in Appendix C or FBE (2016a).

FIGURE 3.1: Watershed land cover area by general category (developed, agriculture, forest, and water/wetlands) and total phosphorus (TP) load by general land cover type. This shows that although developed areas cover only 11% of the watershed, these areas are contributing 88% of the TP load to Moultonborough Bay Inlet.
3.2.4 Historical and Future Land Cover Projections: Build-out Analysis
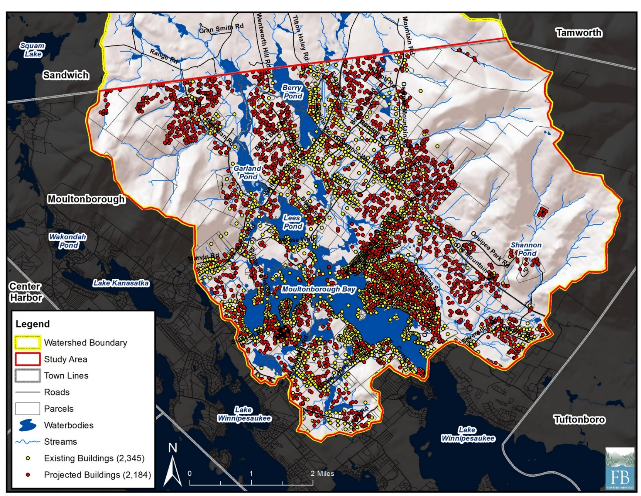
Map of existing and projected buildings in MBI watershed in Moultonborough (see Appendix B for larger map).
With support from the Town of Moultonborough, a build-out analysis was conducted by FB Environmental for the entire Town of Moultonborough, as well as for a portion of the Town within the MBI watershed (FBE, 2016b). The analysis combined projected population estimates, current zoning restrictions, and a host of additional development constraints (conservation lands, steep slope and wetland regulations, existing buildings, soils with low development suitability, and unbuildable parcels) to determine the extent of buildable areas in the town and watershed. The analysis determined that 26% (5,253 acres) of the portion of the watershed in the Town of Moultonborough is buildable and can house up to 2,184 more buildings (a 93% increase from current conditions); most of the new development would be contained in the residential/agricultural zones.
At the compounded annual rate of population growth that the Town of Moultonborough experienced from 2000-2010 (-1.03%), 1990-2010 (1.58%), 1980-2010 (2.04%), and 1970-2010 (2.86%), full build-out for the portion of the watershed in the Town of Moultonborough could occur as early as 2058, 2049, or 2039 for the 20-, 30-, and 40-year compound annual growth rates (CAGRs), respectively. Full build-out refers to the time and circumstances in which, based on a set of restrictions (e.g., environmental constraints and current zoning), no more building growth can occur, or the point at which lots have been subdivided to the minimum size allowed.
Results of this analysis reinforce the concept of comprehensive planning at the watershed level to address future development and its effect on the water quality of the region. A phosphorus load analysis using the LLRM was conducted for historical and full build-out scenarios for the MBI watershed (e.g., what in-lake TP concentration was prior to human development and what in-lake TP concentration will be following full buildout of the watershed under current zoning restrictions and conservative growth rates). A comparison of historical, current, and future in-lake TP concentrations for the three basins is shown in Figure 3.2.
 Historical median in-lake TP concentration ranged from 2.9-4.9 ppb compared to 9.4-14.8 ppb for the three basins under current conditions (Figure 3.2). This represents an increase of 64-130% compared to current conditions. Basin 3 Direct and Shannon Brook subdrainages changed the most from historical to current conditions, likely a result of concentrated development in these drainages. The historic assessment is useful to provide an estimate of the best possible water quality for the Inlet. In this case, historical in-lake TP concentrations are well within oligotrophic criteria, suggesting that an oligotrophic classification and goal may be at least theoretically realistic for MBI.
The model predicted an in-lake TP concentration of 22.5, 14.5, and 16.6 ppb in Basins 1, 2, and 3, respectively, at full buildout in 2058 (based on conservative 20-year average annual growth rate of 1.58% and current zoning). This represents an increase of 40-43% compared to current conditions. Any new increases in phosphorus to a lake can disrupt the ecological balance in favor of increased algal growth, resulting in degraded water clarity. Shannon Brook is most at risk for increases in TP loading as a result of increased development. A more detailed discussion of watershed modeling results with a breakdown of loading by subwatershed can be found in Appendix C or FBE (2016a).
3.3 ESTABLISHMENT OF WATER QUALITY GOALS Return to Top
The purpose of setting a water quality goal in a phosphorus-focused watershed restoration plan is to quantify the amount of reductions in phosphorus loading needed to achieve the desired water quality conditions. The process of establishing water quality goals for MBI was guided by the water quality and assimilative capacity analysis and watershed modeling conducted by LWA, FB Environmental, and DK Water Resource Consulting, as well as input and approval from the Advisory Committee.
The over-arching goal for the watershed is to improve water quality conditions at MBI and to protect the waterbody from future, unaccounted-for inputs of phosphorus because of new development in the watershed over the next twenty years. The Advisory Committee set a water quality goal of 7.2 ppb TP (for summer median epilimnion TP) for Basins 1, 2, and 3, along with adaptable interim goals and milestones that will help achieve this goal over the next twenty or more years. This will require a phosphorus loading reduction of 42% (26 kg/year) in Basin 1, 31% (27 kg/year) in Basin 2, and 20% (242 kg/year) in Basin 3.
The following describes interim goals, milestones, and goal adaptation strategies for the three basins:
- BASIN 1 requires a 42% (26 kg/yr) reduction in TP loading to achieve the oligotrophic classification goal of 7.2 ppb for in-lake summer median epilimnion TP (Table 3.9). Current in-lake Chl-a concentrations require a 10% reduction to achieve the oligotrophic classification goal of 3.0 ppb for in-lake summer median epilimnion Chl-a; this Chl-a goal could be achieved with only a 9% (6 kg/yr) reduction in TP loading. Basin 1 has experienced the greatest increase in in-lake TP concentration since pre-development and will continue on a more aggressive upward trajectory than the other two basins. Any improvement or degradation in Basin 1 water quality will decrease or increase in-lake TP concentrations by 14% for Basin 2 and 1% for Basin 3. Since Basin 1 is at most risk for elevated nutrient inputs and algal blooms, has the lowest total TP load reduction needed (26 kg/yr), and drains a relatively small, manageable watershed, Basin 1 may be ideal for priority project implementation to achieve the water quality goal on a faster timescale. Successful projects in the Basin 1 drainage can serve as examples to be replicated in the other basin drainages. This prioritization hinges on local resident engagement throughout the process.
- BASIN 2 requires a 31% (27 kg/yr) reduction in TP loading to achieve the oligotrophic classification goal of 7.2 ppb for in-lake summer median epilimnion TP (Table 3.9). These reduction estimates are based on minimal data; therefore, we recommend collecting several years of data (epilimnion and hypolimnion TP, Chl-a, and SDT) for WMO01BL (Blanchard’s Island), updating the LLRM for Basin 2, and revisiting the water quality goal in 5 years. One important consideration for the Basin 2 water quality goal is Chl-a, which dictates support determinations. Preliminary data show that Chl-a may be better than the reserve capacity threshold (3.0 ppb) for oligotrophic systems, but until more data are collected for Basin 2, the water quality goal will be based on the achievement of 7.2 ppb TP with the understanding that this goal may change given the likely acceptable Chl-a levels in Basin 2.
- BASIN 3 requires a 20% (242 kg/yr) reduction in TP loading to achieve the oligotrophic classification goal of 7.2 ppb for in-lake summer median epilimnion TP (Table 3.9). These reduction estimates are based on an aggregate of multiple sites within Basin 3, but future monitoring and modeling should focus on a single, sentinel station for Basin 3; therefore, we recommend collecting several years of data (epilimnion and hypolimnion TP, Chl-a, and SDT) for WMO01LL (Little Ganzy), updating the LLRM for Basin 3, and revisiting the water quality goal in 5 years. Implementation projects should begin right away in the Basin 3 drainage, particularly in the direct shoreline and Shannon Brook drainages where development is concentrated (Suissevale and Balmoral) or in areas at most risk for new development. Development in the direct shoreline and Shannon Brook drainages account for 107 kg/yr and 96 kg/yr, respectively, of TP loading to Basin 3, both of which account for a significant portion of the total TP load reduction needed (242 kg/yr). One important consideration for the Basin 3 water quality goal is Chl-a, which dictates support determinations. Preliminary data show that Chl-a may be better than the reserve capacity threshold (3.0 ppb) for oligotrophic systems, but until more data are collected for WMO01LL (Little Ganzy), the water quality goal will be based on the achievement of 7.2 ppb TP with the understanding that this goal may change given the likely acceptable Chl-a levels in Basin 3.
An important consideration for adjusting interim goals during the adaptive management process is how the expected increase in TP loading following new development in the watershed will impact ultimate and interim water quality goals. Over the next twenty years, new development using business-as-usual regulations will likely increase current TP loading by 16, 22, and 294 kg/yr to Basins 1, 2, and 3, respectively (Table 3.9). This will hinder progress toward achieving ultimate and interim goals. Given this consideration, it will be just as important to focus on updating municipal regulations to incorporate more stringent water quality protections during new development as it will be to minimize TP loading from existing development.

Ultimate and interim water quality goals for each basin are outlined in Section 5.3. The interim goals allow flexibility in re-assessing water quality goals following more data collection and incorporation of expected increases in TP loading with new development in the watershed over the next twenty years. Understanding where we will be following watershed improvements compared to where we should have been following no action will help guide adaptive changes to the goals (e.g., goals are on track or goals are falling short). If the goals are not being met due to lack of funding for implementation projects versus new development TP loading outpacing improvements to existing development TP loading, this creates much different conditions from which to adjust goals. For each interim goal year, the committee should meet to update water quality data and model and assess why goals are or are not being met. The committee will then decide on how to adjust the next interim goals to better reflect water quality conditions and practical limitations to implementation.
It is also important to note that there are several larger ponds within the Basin 3 drainage that should set their own water quality goals and TP reduction goals to help improve water quality in MBI.
