Watershed and Shoreline Survey Assessments
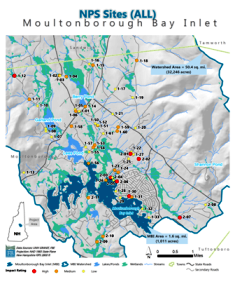
Soil erosion is the largest source of phosphorus in New Hampshire lakes. The watershed survey identified 56 sites where erosion could be contributing pollution to the MBI Inlet.
During large precipitation events in forested areas, it is natural for approximately 10% of rain or snowmelt to flow as runoff. In developed areas, however, runoff volumes (a.k.a., stormwater runoff or NPS pollution) increase five-fold due to impervious surfaces, including packed dirt or paved roads, parking lots, and rooftops. Stormwater pollutants can have negative consequences for fish and wildlife, native vegetation, public drinking water sites, and public recreational water usage. Stormwater retrofits (i.e., BMPs) can be utilized for existing development where stormwater issues are prevalent. Landowners, municipal officials, and developers should also consider alternatives such as LID for mitigating impacts from any new development.

The 2015 watershed survey identified 56 sites where stormwater improvements are needed. (Photo: FB Environmental)
Watershed and shoreline surveys are designed to locate potential sources of NPS pollution in an area that drains to a waterbody. These surveys are an excellent education and outreach tool, as they raise public awareness by documenting types of problems, engaging volunteers, and providing specific information to landowners on how to reduce NPS pollution on their property. Results of these surveys are essential to the watershed planning process because they identify individual NPS sites and prioritize BMP implementation projects throughout the watershed (refer to the Action Plan in Section 5.2).
A watershed stormwater survey was conducted on May 18 and 19, 2015 by FB Environmental. Teams documented erosion on roads, residential and commercial properties, driveways, stream crossings, and municipal areas using cameras and standardized forms. Problems were identified and documented, solutions were recommended, and costs of improvements (labor and materials) were estimated. Impact levels were assigned to each site based on location, area, slope, amount of soil eroded, and proximity to water.
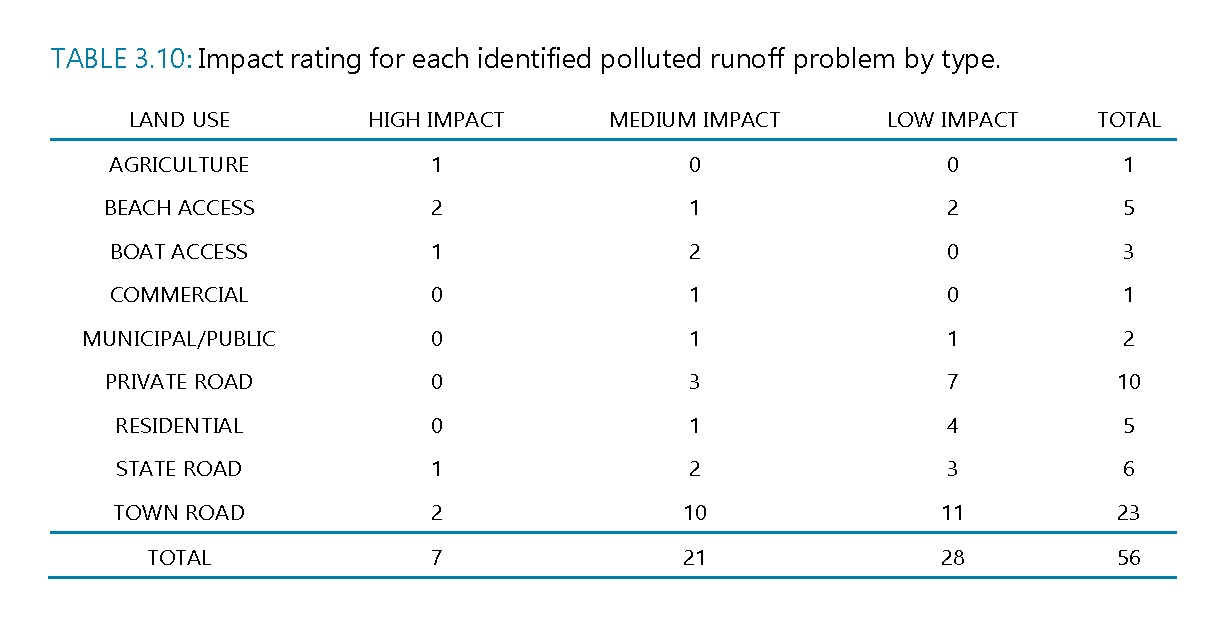
Fifty-six sites were documented during the stormwater survey. Twenty-three sites were located on town roads (Table 3.10). These sites were often a result of eroding road shoulders and unstable culverts. Ten sites were located on private roads, primarily on the northeast side of the Inlet. Half of the identified sites were considered low impact (Table 3.10); however, fixing multiple low impact sites can have an overall greater impact on erosion control. Just over half (55%) of the identified sites were of medium cost to repair ($500-$2,500). Refer to the MBI Watershed Nonpoint Source Survey Report for more details (FBE, 2015).
Implementing erosion control and stormwater runoff control improvements at these sites to limit phosphorus loading to MBI will require efforts by individual property owners, road associations, and municipal officials. The top twenty sites for remediation were selected based on the impact-weighted cost per mass of phosphorus reduced (refer to Appendix D). From these twenty high-priority sites, the Advisory Committee selected four sites for completion of engineered designs by the UNH Stormwater Center (UNHSC). The four high impact sites are summarized below and UNHSC designs are included in Appendix E).

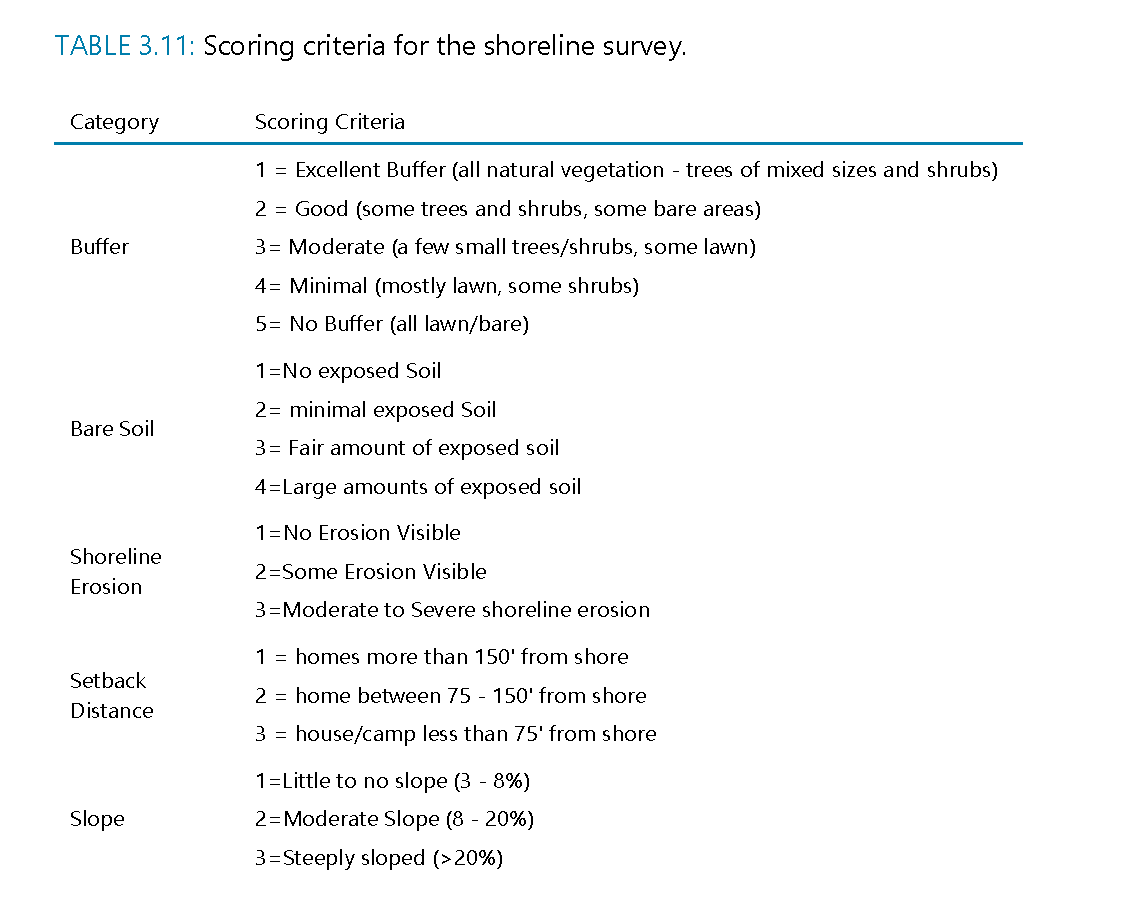
A shoreline survey of MBI, Garland Pond, and Lees Pond was conducted in August and September of 2015 by FB Environmental staff and local volunteers. Teams documented the condition of the shoreline for each parcel using a scoring system that evaluates buffer condition (1-5), bare soil extent (1-4), shoreline erosion extent (1-3), building setback distance (1-3), and slope (1-3) (Table 3.11). The score for each category was summed for each site as a total “shoreline disturbance score†used to help with BMP prioritization and highlighting areas along shorelines where mitigation efforts should be focused. Lower scores equate to better shoreline conditions, while higher scores correspond to inadequate shoreline conditions with extensive erosion. A disturbance score of 10 or above indicates shoreline conditions that may be detrimental to water quality.
Of the 549 parcels evaluated, the average shoreline disturbance score for MBI was 9.8 (Table 3.12). A total of 6 parcels scored 15 or greater (out of a maximum of 18) and may contribute 13 kg of phosphorus load to MBI annually[1]. If shoreline property owners were to create adequate buffers and install other shoreline BMPs (at a 50% BMP efficiency rate), the annual reduction would be 6 kg of phosphorus. A total of 330 parcels scored 10-14 and may contribute 105 kg of phosphorus annually[2]. Remediation efforts on these properties using a 50% BMP efficiency rate could result in an annual reduction of 52 kg of phosphorus.
Of the 11 parcels evaluated, the average shoreline disturbance score for Garland Pond was 5.1 (Table 3.12). Garland Pond had the lowest scores because a large parcel of land is owned and conserved by The Nature Conservancy. Development around the pond is minimal with only one developed parcel containing a home visible from the shoreline. Pollutant load estimates were not generated for Garland Pond due to the low scores and the likelihood that the majority of nutrients entering Garland Pond are not the result of shoreline development.
Of the 56 parcels evaluated, the average disturbance score for Lees Pond was 8.1, ranging from 5-14 (Table 3.12). Parcels around Lees Pond were smaller compared to Garland Pond and had more shoreline residential development. A total of 17 parcels scored 10-14 and may contribute 5 kg of phosphorus load to Lees Pond annually. Remediation efforts on these properties using a 50% BMP efficiency rate could result in an annual reduction of 3 kg of phosphorus.
[1] Based on Region 5 model bank stabilization estimate for sandy soils, using 100 ft (length) by 5 ft (height) and moderate lateral recession rate of 0.2 ft/yr.
[2] Based on Region 5 model bank stabilization estimate for sandy soils, using 50 ft (length) by 3 ft (height) and moderate lateral recession rate of 0.1 ft/yr.
The shoreline survey data and the maps generated (refer to Appendix B, F and FBE, 2016c) highlight areas contributing NPS pollution to these waterbodies, help determine actions needed to reduce NPS pollution and achieve the water quality goal for MBI, and help prioritize areas for shoreline restoration using stormwater BMPs.

Lack of vegetative buffer (left) results in delivery of excess nutrients and sediments in the Inlet compared to vegetated shoreline areas (right).

Photo: FB Environmental