Water Quality
While the overall water quality of Lake Winnipesaukee is considered good, long term datasets show a negative trend.
Water Quality Data Analysis
As one of the first tasks in the management plan process, analysis was done on the existing water quality data available for the last ten years (1999-2009) for Meredith Bay, Paugus Bay and Saunders Bay to determine the median total phosphorus (P) and mean chlorophyll-a values, and to determine the assimilative capacity of the sub-basins as compared to the State Standard for P (refer to Water Quality and Lake Health). Water quality data for Lake Waukewan was also included as it contributes a significant volume of water to Meredith Bay.
Water Quality Analysis (1999-2009)
| Waukewan | Meredith Bay | Paugus Bay | Saunders Bay | |
|---|---|---|---|---|
| Total P (ug/L) | 7.1 | 6.3 | 4.8 | 5.4 |
| Chl-a (ug/L) | 2.5 | 1.9 | 2.1 | 1.5 |
Assimilative Capacity Analysis
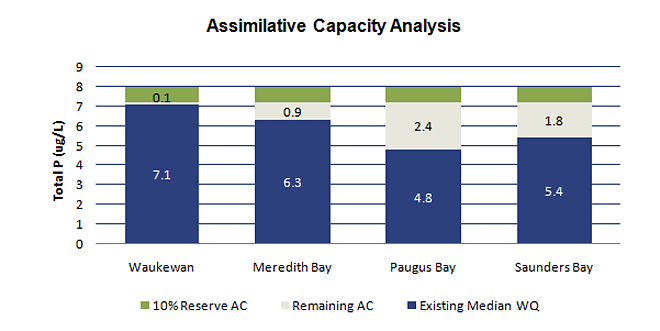
The assimilative capacity of a water body describes the amount of pollutant that can be added to that water body without causing a violation of the water quality criteria. The water quality nutrient criterion for phosphorus has been set at 8ug/L for an oligotrophic water body (high quality water). The NHDES requires 10% of the state standard to be kept in reserve; therefore phosphorus levels must remain below 7.2 ug/L to be in the Tier 2 High Quality Water category.
Assimilative Capacity (AC) for Total Phosphorus (TP)
- Total AC = (Water Quality Standard (8 ug/L TP) – Best Possible WQ (0 ug/L) = 8.0 ug/L TP
- Reserve assimilative capacity = 0.10 x Total AC = 0.8 ug/L P
- Remaining assimilative capacity = 7.2 ug/L – Existing WQ
An analysis of a waterbody’s assimilative capacity is used to determine the total assimilative capacity, the reserve assimilative capacity, and the remaining assimilative capacity of each water quality parameter being considered. This information is then used to determine water quality goals and actions necessary to achieve those goals. The assimilative capacity analysis is conducted in accordance with the Standard Operating Procedure for Assimilative Capacity Analysis for New Hampshire Waters.
Results of Assimilative Capacity Analysis
The results of the assimilative capacity analysis for Lake Waukewan, Meredith Bay, Paugus Bay, and Saunders Bay are shown in the graph below. The existing median TP values provide an indication of current water quality; however, limited data emphasizes the need for continued monitoring in Lake Waukewan and the three bays.
The water quality data and assimilative capacity analysis support Lake Winnipesaukee’s designation as a high quality water and oligotrophic classification.
In-Lake Models Return to Top
The phosphorus loads estimated from the STEPL (Spreadsheet Tool for Estimating Pollutant Load) land use model (refer to the Issues of Concern tab for results of the STEPL analysis) were input into trophic lake models that predict the in-lake response to the loading.
In other words, how will the lake respond to X amount of phosphorus?
This approach provides a useful tool to communities in planning for future growth as they can use the model to predict the in-lake response from future increased loadings. Communities need to be aware that once in-lake phosphorus levels reach 7.2 ug/L, the water body will fall into the Tier 1 category, be considered impaired, and no further phosphorus loading will be allowed by the State. This has potential implications on development – a community would need to demonstrate that a proposed project would not result in any additional nutrient loading to the receiving waterbody.
The in-lake trophic models predict in-lake phosphorus levels at spring overturn, when the lake is fully mixed throughout the water column. The results of several models were averaged to predict in-lake P; including two well known models used by lake managers, limnologists, and researchers, the Dillon-Rigler and Vollenweider models. Refer to the MPSB Site Specific Project Plan (PDF, 61kb) for more details on the modeling.
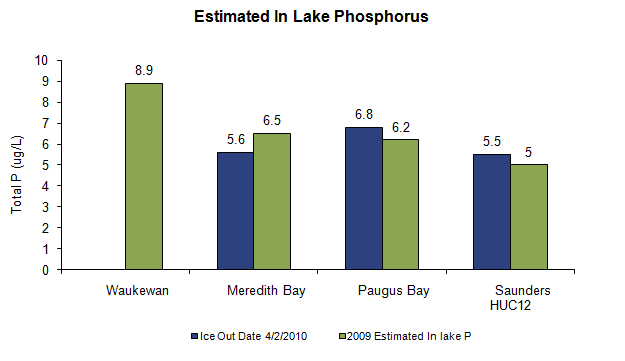
Spring overturn occurs shortly after ice out; the lake water begins to thermally stratify in a relatively short time thereafter providing a small window of opportunity to collect water samples. Ice out occurred on March 24, 2010, the earliest ever recorded in the 120 years since it’s been tracked. On April 2, 2010 a group of volunteers, NHDES, UNH, and PSU scientists collected over 150 water samples from Lake Winnipesaukee at twelve (12) designated deep spots to determine phosphorus levels at spring overturn (see map). As water samples at ice out had never been collected on the lake before, this offered a great opportunity to verify the models.
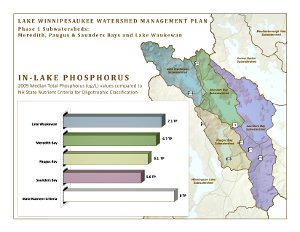
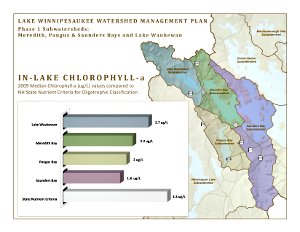
The estimated in-lake P values for each sub-basin are based on the results of the STEPL and In-Lake Trophic Response models. As mentioned under the Land Use and Phosphorus Loading section of the Issues of Concern page, land use characteristics, rainfall and runoff data, and hydrologic soil type are factors that impact pollutant load estimates.
 |
 |
Factors that influence a lake or water body’s response to pollutant loading from the land are lake volume, mean depth, flushing rate, and the watershed area to water area ratio. Determining land use impacts for each of the sub-basin areas is more difficult than if each were a stand alone water body. Annual water loads and volume inputs from other areas of the lake need to be calculated for each sub-basin, along with the morphometric characteristics mentioned above. Andy Chapman, Clean Lakes Program, NH Department of Environmental Services provided the much needed assistance in calculating the estimated flows, water volumes and flushing rates for all the sub-basins of Lake Winnipesaukee.
A summary of the STEPL modeling analysis and the in-lake P trophic model response is provided below.

The graph below compares the spring overturn data results to the predicted in-lake P from the models. Although the Waukewan Watershed was included in the modeling, ice out data was not collected for Lake Waukewan.
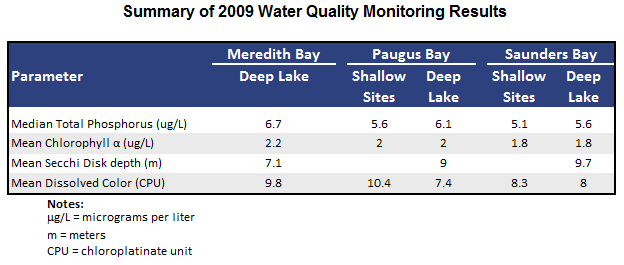
To provide further verification of the models, and as a base line for future comparison of in-lake P values, a water quality monitoring component was added to the project. The full 2009 Water Quality Report can be found on the Monitoring the Lake page; however, the major results are shown in the table below.
