
Lake Health and Water Quality
Phosphorus loading can lead to algal blooms, decreasing water quality and damaging the ecology and esthetics of a lake.
- Why is Water Quality at Risk?
- Why is Runoff a Problem?
- Why should we protect Lake Waukewan and Lake Winona?
- Limnology and Ecology
- Assimilative Capacity Analysis
Why is Water Quality at Risk? Return to Top
As with most New Hampshire lakes, the primary pollution source in the Lake Waukewan and Winona watershed is polluted runoff or nonpoint source (NPS) pollution. Stormwater runoff from rain and snowmelt picks up soil, nutrients and other pollutants as it flows across the land, and washes into the lake.
In an undeveloped forested watershed, stormwater runoff is slowed and filtered by tree and shrub roots, grasses, leaves, and other natural debris on the forest floor. Â It then soaks into the uneven forest floor and filters through the soil.
In a developed watershed, however, stormwater does not always receive the filtering treatment the forest once provided. Â Rainwater picks up speed as it flows across impervious surfaces like rooftops, compacted soil, gravel camp roads and pavement, and it becomes a destructive erosive force.
Why is Runoff a Problem? Return to Top
Nutrient over enrichment has consistently ranked as one of the top causes of water quality impairment in the U.S. (U.S. EPA, 2000a), with stormwater runoff from developed land areas as the major source for most lakes. Studies have shown that runoff from developed areas has five to ten times the amount of phosphorus compared to runoff from forested areas (NHDES, 2010). Other activities that contribute nutrients to lakes are lawn and garden fertilizers, faulty septic systems, washing with soap in or near the lake, soil erosion, dumping or burning leaves in or near a lake, and feeding ducks.
Although phosphorus (P) is not the only pollutant of concern affecting water quality, it is the most limiting nutrient in freshwater ecosystems for aquatic plant productivity. The nutrient phosphorus is food for algae and other plants and is found in soils, septic waste, pet waste and fertilizers. In natural conditions, the scarcity of phosphorus in a lake limits algae growth. However, when a lake receives additional phosphorus, algae growth increases dramatically. This growth may cause algal blooms, but more often results in small changes in water quality that, over time, damage the ecology, aesthetics and economy of lakes.
 Soil erosion is the largest source of phosphorus in New Hampshire lakes. Phosphorus is bound in soil by adhering to the surface of soil particles. Erosion and sediment transport, including eroding stream banks, roadway runoff, and exposed soil on construction sites are all potential phosphorus sources. High intensity rain events result in untreated stormwater transported from the land and the road network to storm drains and catch basins which discharge directly and indirectly to surface waters.
Why Should We Protect Lake Waukewan and Winona from Polluted Runoff? Return to Top
- Once a lake becomes polluted, it can be difficult or impossible to restore. Prevention is the key.
- The lake and stream systems within the watershed are valuable habitat for fish, birds and other wildlife.
- Lake Waukewan and Lake Winona support various warm and coldwater fisheries which include rainbow and brown trout, large and smallmouth bass, pickerel and horned pout among other species.
- Lake water quality affects property values. Studies in Maine and New Hampshire have stated that for every three-foot decline in water clarity, shorefront property values can decline as much as 5-10%. Declining property values affect individual landowners as well as the entire community.
- Sediment deposited into waterbodies from erosion creates the ideal environment for invasive aquatic plant species. These species can be transported via boats to other lakes and ponds.
Limnology and Ecology of Lakes Waukewan and Winona Return to Top
The size and shape of a lake basin affect nearly all physical, chemical, and biological parameters of the lake. Other physical characteristics influencing a lake’s productivity include geology, topography and land use, watershed area to lake area ratio, residence time, and flushing rate. As mentioned above, productivity in freshwater ecosystems is related to the nutrient load, particularly total phosphorus (TP) as demonstrated by Schindler in the early 1970’s (see http://winnipesaukeegateway.org/lake-management/water-quality-and-lake-health/).
Lake Morphology and Bathymetry: Lake morphology (surface area, perimeter, volume) and bathymetry (depth contours) data are used to evaluate how the lake responds to nutrient inputs. Bathymetry data is also used to calculate internal loading; using the bathymetry data, the area of the lake bottom covered by anoxic waters may be calculated.
Lake Waukewan is the largest waterbody within the watershed with an area of approximately 928 acres and a maximum depth of 21.4 meters.  The lake is relatively long and narrow with a length to width ratio of 4:1. Lake Waukewan has a total shoreline length of 8.1 miles or 42,650 feet.  The shores are largely developed with both year-round and seasonal residential development. There are 7 islands in the lake, 5 of which have structures on them. The lake is the primary drinking water supply for the town of Meredith serving over 3,000 residents and the Meredith Village Business community. It is fed by the outflow of the Snake River, which flows from Winona Lake to the north, and five other inflows. Waukewan’s outlet is controlled by a dam which releases water to Meredith Bay in Lake Winnipesaukee.
Lake Winona is smaller with a surface area of 148 acres and a maximum depth of 14.6 meters. The lake is long and narrow with a length to width ratio of 10:1. Lake Winona has a total shoreline length of 3.1 miles or 16,513 feet. The shores are developed with both year-round and seasonal residential development. There are 6 inflows to the lake and the outflow leads to the Snake River. The lake has two islands; both of which have structures on them. Lake Winona is classified as a “natural lake†by NHDES.
| Waukewan Watershed | Waukewan & Winona Bathymetry | ||||
 |
 |
| Watershed | Lake Winona | Lake Waukewan |
|---|---|---|
| Towns: | Center Harbor, Ashland, Holderness, New Hampton | Center Harbor, Meredith, Ashland, Holderness, New Hampton |
| HUC Number: | 010700020109 | 010700020109 |
| Shore Length (m): | 6122.8 | 16,513 |
| Mean Depth (m): | 5.3 | 6.6 |
| Max Depth (m): | 14.6 | 21.4 |
| Watershed Area (acres): | 3369 | 8277.8 |
| Watershed Area (m2): | 13,637,097 | 33,607,000 |
| Lake Area (m2): | 599,000 | 3,754,000 |
| Volume (m3): | 3,146,179 | 24,845,058 |
| Watershed Area/Lake Area: | 22.8 | 9 |
| Areal Water Load (m/yr): | 14.2 | 5.5 |
| Flushing rate (yr-1): | 2.68 | .84 |
| Downstream Waterbody: | Lake Waukewan | Meredith Bay |
Lake Level Management
NHDES classifies Lake Waukewan as a “natural lake with a damâ€. A lake level investigation conducted by the NHDES Dam Bureau from 2008 to 2011, “determined that a summer recreational level of 540.0 feet on Lake Waukewan is protective of the ecology of both Lake Waukewan and Lake Winona and strikes a proper balance among the many factors that NHDES must consider including balancing the interests of those whose use and enjoyment of the lakes are affected by high lake levels, and those whose use and enjoyment are affected by low lake levelsâ€. In addition, NHDES allows for the drawdown of the lake for flood control to an elevation of 538.5 feet. Drawdown begins Columbus Day of each year with the goal of refilling Lake Waukewan to its summer level of 540.0 feet by May 15th (NHDES, 2011: Lake Waukewan Notice of Decision – Final Operating Level). A copy of the complete Lake Waukewan Notice of Decision can be found in Appendix D.
Lake Waukewan and Lake Winona Water Quality Summary
For a discussion of the NH Surface Water Quality Criteria, and how the water quality of Lakes Waukewan and Winona compares to it, please refer to the Water Quality and Lake Health section under the Lake Management tab.
An analysis of the existing water quality data available for the last ten years (2004-2013) for Lake Waukewan and Winona Lake was performed to determine the median total phosphorus (TP), median chlorophyll-a (Chl-a) values, and median water clarity (secchi disk depths) for each lake to determine if the waters of each lake meet the Tier 2 High Quality Water criteria set by the NH Department of Environmental Services (NHDES).
The major source of the water quality data comes from measurements and samples collected by volunteers under the NHDES Volunteer Lake Assessment Program (VLAP). Lake Winona has one deep water site, WINNWHD; sampling frequency varies year to year, from a minimum of one to a maximum of three samples collected June through September. Two deep water sites are monitored on Lake Waukewan, WAUMERMD – Mayo Station N, WAUMERWD – Winona Station S; approximately three samples are collected each season, monthly from July through September. There is also a shallow site WAUMERP-Perkins Cove on Lake Waukewan that is sampled; however, data from shallow lake sites is not included in the assessment.
Phosphorus and chlorophyll-a data collected from the epilimnion (upper surface layer) between May 24 and September 15 are used to determine the summer median TP and Chl-a values for each waterbody. The median values for each water quality parameter (TP, Chl-a, Secchi depth) for Lake Waukewan were arrived at by first determining the median value of each water quality parameter for each site sampled during 2004 to 2013; the median of the two sites was then used to represent the overall lake value for the parameter.
As mentioned in the Introduction, Lake Waukewan and Lake Winona are impaired for low dissolved oxygen (DO) concentrations and saturation in the bottom depths. Both lakes are classified as Class A waters. NHDES water quality standard for DO for a Class A waterbody is 6 mg/L, or 75% minimum daily average saturation. The trophic point system for dissolved oxygen looks at the percentage of the hypolimnion that is anoxic and assigns points accordingly. In addition, for Class A waters, the point system looks at the dissolved oxygen values (DO) throughout the entire water column except for the bottom meter.
Summaries of the annual water quality data for each lake can be accessed at the NHDES website http://des.nh.gov/organization/divisions/water/wmb/vlap/annual_reports/2015/lake-reports.htm. In addition, the NHDES Surface Water Quality Assessment Program produces Watershed Report Cards every two years which provide an analysis of the extent to which lakes and ponds provide for the protection and propagation of a balanced population of shellfish, fish, and wildlife, and allow recreational activities in and on the water (http://des.nh.gov/organization/divisions/water/wmb/swqa/report_cards.htm).

Deep lake sampling stations on Lake Winona and Lake Waukewan

Summary of 2004-2013 water quality data for Lake Waukewan and Lake Winona
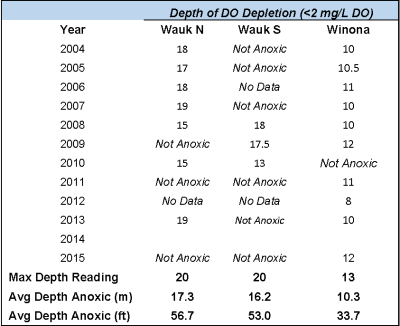
Summary of Dissolved Oxygen data for 2004-2015 for Lakes Waukewan and Winona.
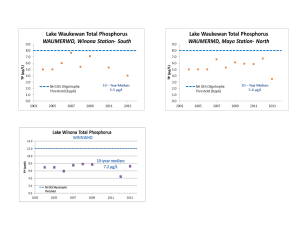
10-Year Median Total Phosphorus Summer Epilimnion Concentrations, Deep Spots, Lake Waukewan and Winona
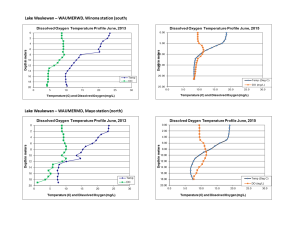
Dissolved Oxygen Profiles for Lake Waukewan
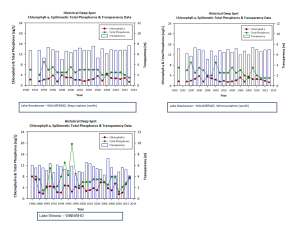
Historical Water Quality Data for Lake Waukewan and Lake Winona
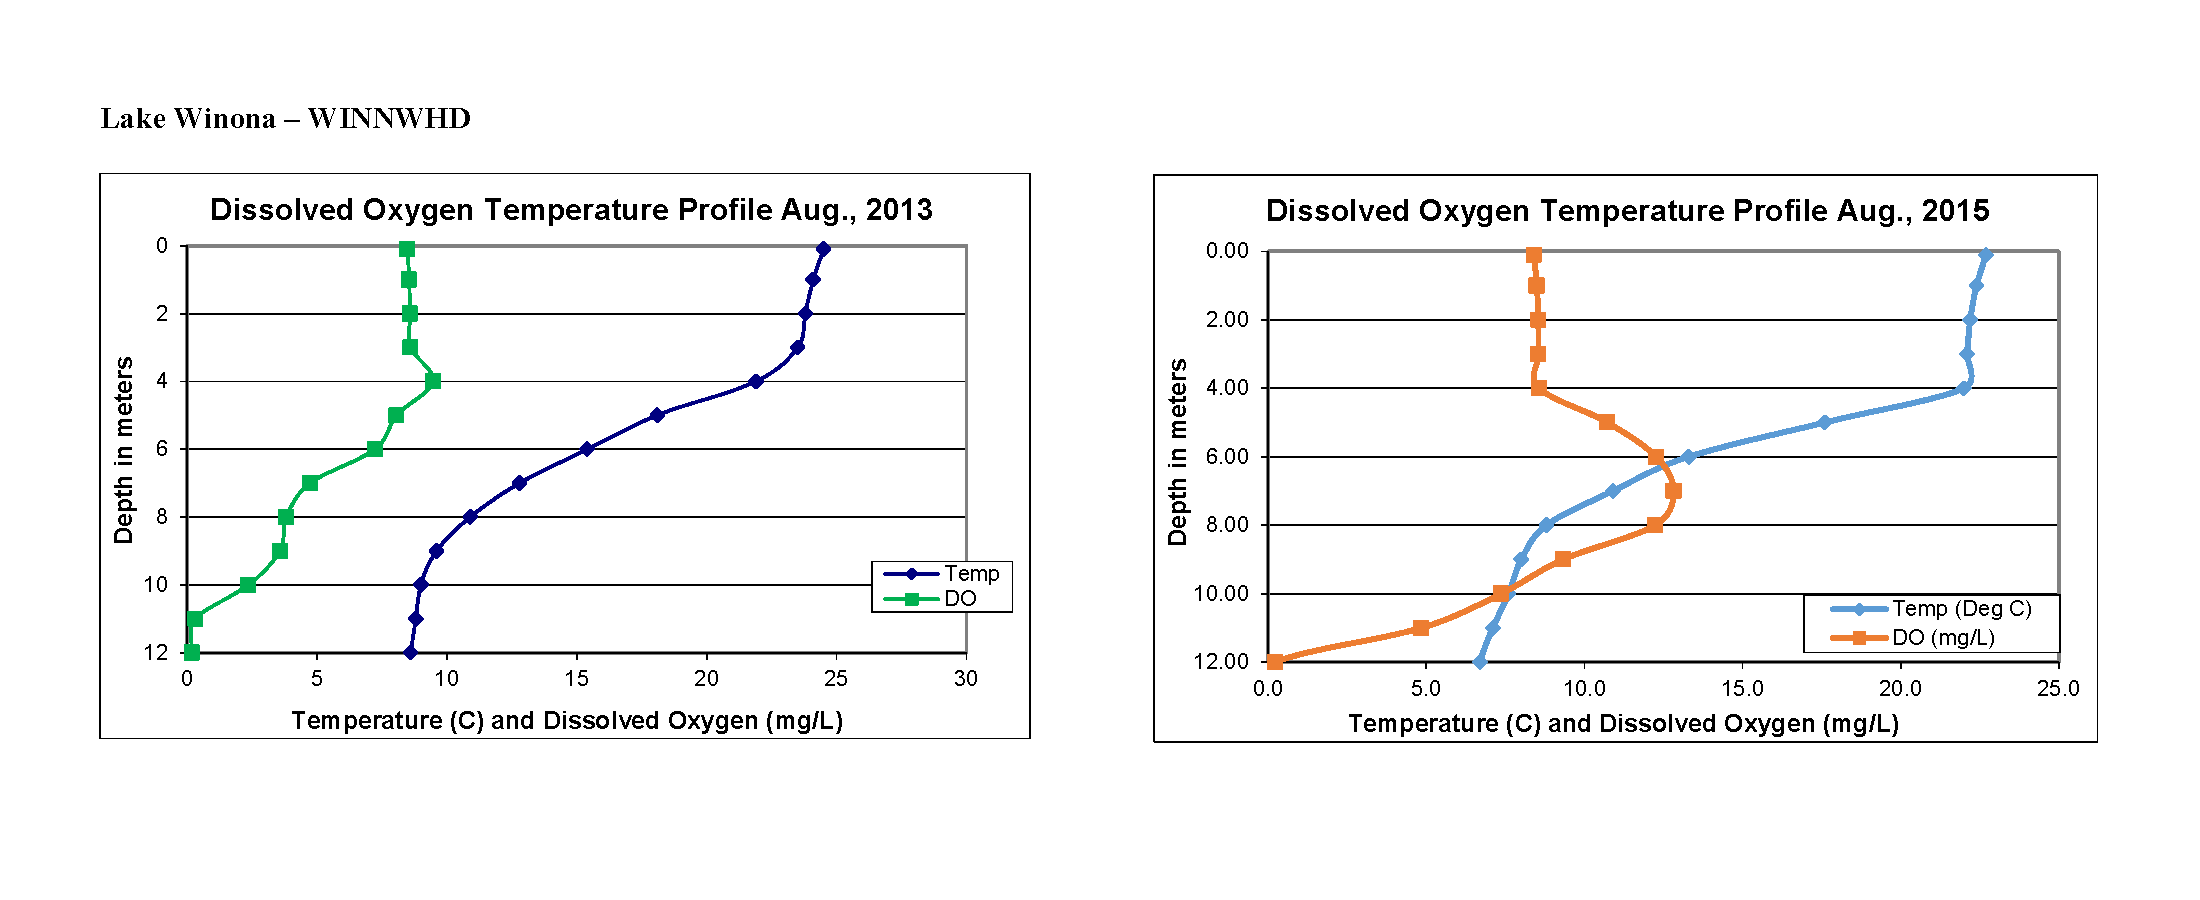
Recent Dissolved Oxygen Profiles for Lake Winona
Tributary Data
Tributary data were gathered from NHDES OneStop. Mean and median total phosphorus values have been calculated for all monitoring sites within the study area watershed, assigned to their appropriate subwatersheds, and were used to evaluate the movement of phosphorus through the contributing watersheds of the study lakes.
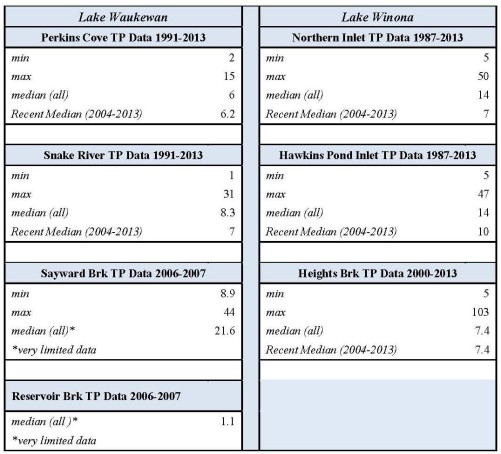
Statistics for lake tributaries in the study watershed (TP data in µg/L)
Assimilative Capacity Analysis Return to Top
The assimilative capacity of a water body describes the amount of pollutant that can be added to that water body without causing a violation of the water quality criteria. The water quality nutrient criterion for phosphorus has been set at 8µg/L for an oligotrophic waterbody (high quality water) and <=12 µg/L for a mesotrophic waterbody. The criteria for chlorophyll-a is <3.3 µg/L for an oligotrophic waterbody, and <= 5.0 µg/L for a mesotrophic waterbody. The NHDES requires 10% of the state standard to be kept in reserve; therefore, with regards to phosphorus, levels must remain below 7.2 µg/L for oligotrophic and < 10.8 µg/L for mesotrophic waterbodies to be in the Tier 2 High Quality Water category. An example of the calculation for an oligotrophic classed waterbody is shown below.
Assimilative Capacity (AC) for Total Phosphorus (TP)
- Total AC = Water Quality Standard (8 µg/L TP) – Best Possible WQ (0 µg/L TP) = 8.0 µg/L TP
- Reserve assimilative capacity = 0.10 x Total AC = 0.8 µg/L TP
- Remaining assimilative capacity = 7.2 µg/L – Existing WQ
An analysis of a waterbody’s assimilative capacity is used to determine the total assimilative capacity, the reserve assimilative capacity, and the remaining assimilative capacity of each water quality parameter being considered. This information is then used to determine water quality goals and actions necessary to achieve those goals. The assimilative capacity analysis is conducted in accordance with the Standard Operating Procedure for Assimilative Capacity Analysis for New Hampshire Waters.
Results of Assimilative Capacity Analysis
The assimilative capacity analysis determined that both lakes are categorized as Tier 2 for both total phosphorus and chlorophyll-a, the highest water quality category designation possible. Tier 2 indicates that the lakes are not only below the threshold value of phosphorus and chlorophyll-a for their trophic class, but that they are also below the reserve assimilative capacity threshold for their assigned trophic class for these two parameters. The other assimilative capacity designations are Tier 1, which indicates that a lake is below the water quality threshold but within the reserve assimilative capacity (buffer) for their trophic class; and impaired, meaning that the lake has exceeded the water quality standard.
Although Lake Waukewan and Lake Winona would not be considered impaired for total phosphorus or chlorophyll-a, it must be remembered that they are impaired for dissolved oxygen (DO) as the NHDES water quality standard for DO for a Class A waterbody is 6 mg/L, or 75% minimum daily average saturation. Both lakes have recorded low dissolved oxygen concentrations and saturation levels at the deeper depths.
Lake Winona
The existing median TP value for Lake Winona of 7.2 µg/L results in a remaining assimilative capacity of 3.6 µg/L, which qualifies Lake Winona in Tier 2 for a mesotrophic waterbody. The ten-year Chl-a median value of 4.0 µg/L is also below the NH State Nutrient Criterion of <=5.0 µg/L for the aquatic life designated use set for a mesotrophic water body.
Lake Waukewan
The existing median TP value for Lake Waukewan of 5.6 µg/L results in a remaining assimilative capacity of 1.6 µg/L, which qualifies Lake Waukewan in Tier 2 for an oligotrophic waterbody. The existing Chl-a median value of 2.4 µg/L is also below the NH State Nutrient Criterion of <3.3 µg/L for the aquatic life designated use set for the oligotrophic classification.
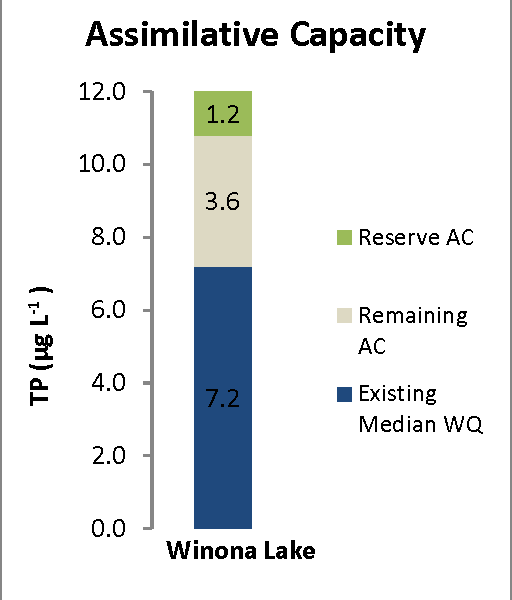
Assimilative Capacity analysis for total phosphorus for Winona Lake

Assimilative Capacity Analysis for Total Phosphorus for Lake Waukewan
