
Lake Sustainability
Landscape change and human activity have the potential to speed up the natural aging process of lakes. Sustainability is obtained when human activity in the lake watershed is managed so that eutrophication occurs at a no greater rate than is natural.
- Lake Sustainability
- Estimation of Current Nutrient Loading
- Natural Background Conditions
- Future Land Use Projections: Build-out Analysis
- Selecting a Water Quality Goal
Lake Sustainability Return to Top
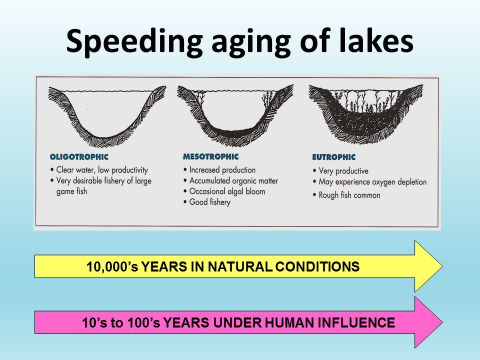
Graphic showing the productivity/trophic classification of lakes
Lakes age naturally as they become more enriched with nutrients over time. Over eons, deep crystal clear lakes become marshes and bogs. Without the visitation of another glacier, Minnesota will someday become the “Land of 10,000 bogsâ€. However, landscape change and human activity have the potential to increase both the rate and quantity of nutrient loading to a waterbody. A process that would naturally take 10,000 years can occur in a lifetime. Land disturbing activities; cutting timber, farming, construction, have increased the rate of nutrient enrichment of lakes, and increased their rate of aging, a process referred to as cultural eutrophication.
Factors affecting watershed nutrient loading include climate (rainfall), watershed characteristics (slope, soil type), and land use. The ability of the receiving waterbody to assimilate the nutrient load is related to the morphometry and hydrology (volume, depth, flushing rate) of the waterbody and determines the in-lake nutrient concentrations, which in turn affect aquatic habitat and lake health.

Generalized Watershed Nutrient Loading and Lake Response Model Schematic (Diagram courtesy of J. Schloss, UNH Center for Freshwater Biology)
Estimation of Current Nutrient Loading Return to Top
Nutrient loading comes from several sources; atmospheric deposition, point sources, watershed loading from tributary and direct runoff, groundwater, septic systems, waterfowl, and internal loading. No point sources were identified in this study. As Lake Waukewan and Lake Winona are freshwater ecosystems, the nutrient of concern is total phosphorus (TP), which is the focus of discussion in the modeling results.
The total phosphorus budget for the Lake Waukewan and Winona sub-watersheds was determined from atmospheric, watershed, septic systems, waterfowl, internal loading and TP loadings from upstream/adjacent basins. Groundwater inputs are accounted for in the watershed loading and are not broken out separately.
Atmospheric Deposition:
Phosphorus inputs from the atmosphere were estimated using a P export coefficient of 0.11 kg/ha/year multiplied by the lake area; resulting in 41.3 kg/year TP to Lake Waukewan and 6.6 kg/year TP to Lake Winona.
Internal Phosphorus Loading:Â
The internal phosphorus load to both lakes was calculated using the difference in total phosphorus concentration between the epilimnion and hypolimnion in September, to reflect conditions during fall turnover (Table 10). This difference in concentration (“Accumulated TP†) is then used to calculate “hypolimnetic TP mass accumulation†by multiplying accumulated TP by the volume of water in the hypolimnion, then converting the value to kilograms. This value is then adjusted by 50%, as it is assumed that half of the TP in the hypolimnion is particulate phosphorus from the epilimnion, and not released by lake sediment. Ideally, concentrations at spring turnover would be used to represent the initial concentration in the hypolimnion but those data are only available for one year. Additional sampling of both total and dissolved phosphorus in the hypolimnion, spring turnover phosphorus concentrations or actual sediment release of phosphorus may allow more accurate estimation of the internal load in the future.
[table "16" seems to be empty /]
Waterfowl:
Presence of waterfowl is included in the model because of the potential of shore birds to directly introduce nutrients to the lake. Current estimates of waterfowl on the study lakes are based on the LLRM model recently completed on nearby Province Lake (re-calculated to account for differences in shoreline length of the present study lakes).  The contribution of phosphorus to lakes by waterfowl is estimated in number of animal-years; 100 birds spending half a year on a lake = 50 bird-years. The estimate from the Province Lake model is 35 bird-years.
Lake      Shore Length (m)   # Waterfowl (bird-Years)
Province         8,500                       35
Waukewan     16,513.00                   30
Winona           6,122.80                   20
Septic Systems:
Nutrient load from septic systems is calculated using mathematical models which calculate output of septic systems based on population data, estimated system age and degree of seasonal use. The septic model used in the Lake Loading Response Model (LLRM) was modified to account for distance to the waterbody as well.
In order to determine the pollutant load from septic systems a count of the number of septic systems within 250 feet of shoreline of Lake Waukewan and Winona Lake was made based on municipal tax parcel data. The majority of properties located along the southern portion of Lake Waukewan are served by municipal sewer, which is also the area of greatest residential density. A count of 181 properties with septic systems was made for Lake Waukewan, and 93 for Lake Winona. There are a number of factors to consider in calculating the potential loading from septic systems; age of the system, distance from the waterbody, number of people on the system, and the number of days it is in use. Although the majority of the properties are seasonal, due to the influx of visitors and residents, the number of people using a system during the summer months may actually be much greater than the annual average.
A review of the property tax lists for Meredith, Center Harbor, and New Hampton provided the following estimation of percent seasonal residents based on out of town or state mailing addresses. For Lake Winona 77 of the 93 properties are in seasonal use, or 83 percent. On Lake Waukewan the percent seasonal use is estimated at 71 %.
To the extent possible, distance to the lake, age of system, and seasonal use were determined from municipal and state records, but must be considered estimates. The average number of occupants for year round and seasonal use is an assumption based on data used in other models calculating nutrient load from septic systems.
The total estimated phosphorus load to Lake Waukewan from septic systems is 28.3 kg; 65% or 18 kg comes from septic systems over 25 years in age, which accounts for fifty percent (50%) of the total number of systems on the lake. The total septic load for Lake Winona is estimated at 13.6 kg; 73% or 10 kg attributed to systems over 25 years in age, which accounts for 61% of the septic systems on the lake.
Watershed Loading
An Excel-based model, known as the Lake Loading Response Model (LLRM), was used to develop a water and phosphorus loading budget for the lakes and their tributaries. The loading model also makes predictions about chlorophyll-a concentrations and secchi disk transparency. Water and phosphorus loads (in the form of mass and concentration) are traced from various sources in the watershed, through tributary basins, and into the lake.
The model incorporates data about land cover, watershed boundaries, point sources, septic systems, waterfowl, rainfall, and an estimate of internal lake loading, combined with nutrient export coefficients and equations from scientific literature on lakes and nutrient cycles. This information is used to determine phosphorus export by land use and therefore can be extrapolated to estimate the number of kilograms (or pounds) of phosphorus that needs to be prevented from entering the lake in order to improve water quality.
There are several limitations to the model; 1) it needs reliable data regarding land use, water quality data, septic systems, and seasonal and year round population estimates specific to the study watershed, 2) it assigns typical phosphorus loading rates for land uses; it does not distinguish between good or bad practices, 3) uses land use area sums only, it is not spatially aware, 4) calculates an average annual phosphorus concentration, whereas water quality data is often seasonal, thus the model and the data may not agree.
The modeling results indicate that the majority of the phosphorus contribution to both lakes is from the watershed load; i.e., phosphorus contained in overland runoff that is introduced to the lakes via streams, as well as sheet flow into the lake from the direct lakeshore drainage area. The contribution of phosphorus from septic systems may be underestimated, as results of the septic system inventory indicate that many of the properties on Lake Waukewan and Winona have septic systems over 40 years in age, which increases the risk of septic system failure and pollutant loading to the lake.
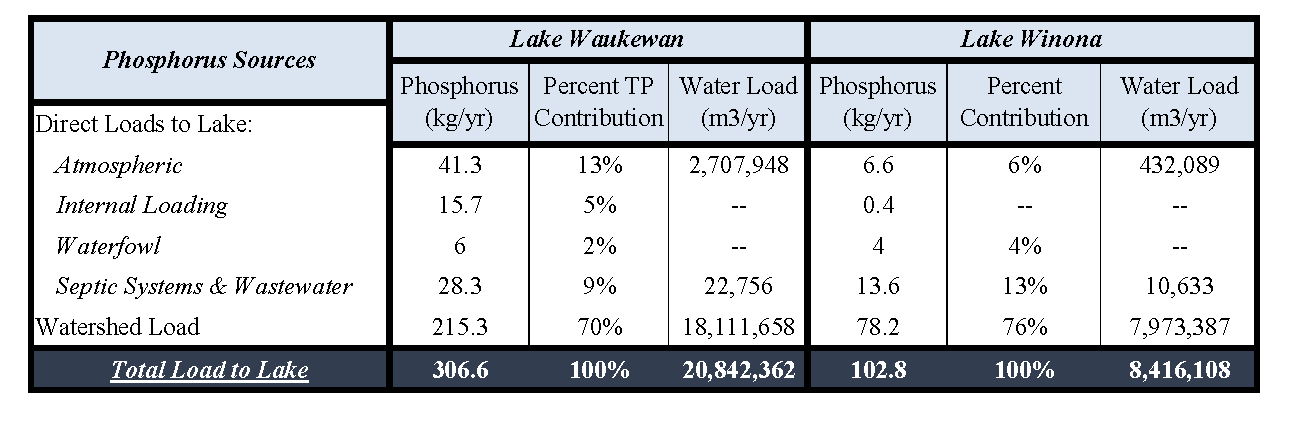
Results of Lake Loading Response Model (LLRM) calculations for phosphorus inputs to Lake Winona and Lake Waukewan.
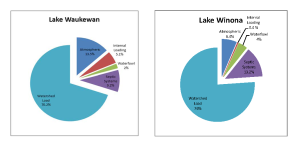
Percent phosphorus contribution by source in the Lake Waukewan and Winona watersheds.
A comparison of land area in the watershed to its corresponding contribution of phosphorus as a function of land use, shows that while the ‘Developed’ land area makes up a relatively small portion of both watersheds, it contributes the highest percentage of phosphorus. Four percent (4%) of the land area in the Lake Winona watershed contributes 39% of the phosphorus; whereas 10% of the land area in the Waukewan watershed contributes 67% of the phosphorus.
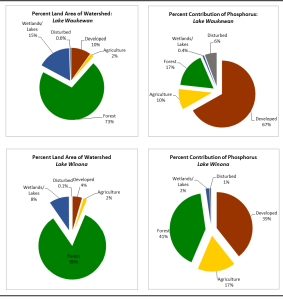
Comparison of percent land area to corresponding contribution of phosphorus in the Waukewan and Winona watersheds.
Watershed Loading – Subwatershed level
The model also calculates the contribution of phosphorus from each of the subwatersheds. In the Lake Waukewan model, the Reservoir Brook and Snake River subwatersheds show the largest contribution of phosphorus. The Snake River subwatershed includes all of the Lake Winona watershed, therefore it has the largest contributing land area of the Waukewan LLRM.
Notably, the calculated concentration of phosphorus in the Snake River inlet to Waukewan is only 6.0 µg/L, which is quite low for a major tributary, but it is the volume of water in the Snake River times the nutrient concentration that equals the total nutrient load to Lake Waukewan. Birch Hill, Town Beach and Pollard Shores are the subwatersheds contributing the highest concentrations of phosphorus to Lake Waukewan. Many subwatersheds contribute relatively low amounts and concentrations of phosphorus to Lake Waukewan – namely, Otter Pond, Mayo Shores, Perkins Cove, Eastern Shore and Forest Hill. EE Brook, Waukewan Islands, and the Waukewan outlet subwatersheds likely contribute only negligible amounts of phosphorus to the lake.
The Lake Winona LLRM suggests that the eastern tributary is contributing the greatest amount of phosphorus in that watershed, however, it includes the phosphorus loading from the Bear Pond and Hawkins Pond subwatersheds, and the load is only marginally higher than the North inlet and the direct shoreline drainage. The Bear Pond subwatershed contributes a very small amount of phosphorus to the system.
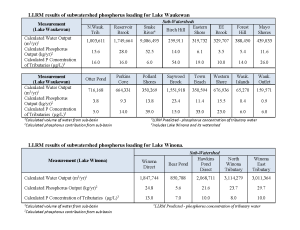
LLRM results of subwatershed phosphorus loading for the Lake Waukewan and Winona subwatersheds.

LLRM estimated Phosphorus loading by subwatershed. Note that due to water routing, the phosphorus load from the Snake River represents the entire Lake Winona watershed, and not the Snake River subwatershed itself.
In-lake Response
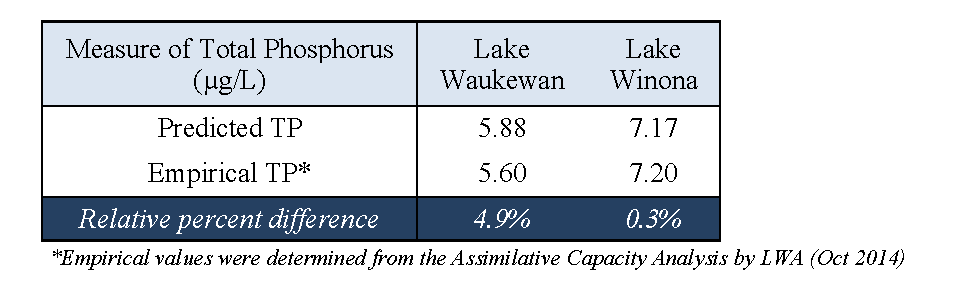
With the total phosphorus loads to Lake Waukewan and Winona estimated, the LLRM is able to predict the in-lake response; in other words, how will the lake respond to X amount of phosphorus? A total estimated TP load of 306.6 kg/year to Lake Waukewan results in a predicted in-lake phosphorus concentration of 5.88 µg/L; while an estimated load of 102.8 kg/year TP to Lake Winona results in a predicted in-lake concentration of 7.17 µg/L TP.
The predicted values from the LLRM for total phosphorus concentrations are close (within 5%) to the empirical values observed in sampling data for Lake Waukewan and Lake Winona, which indicates that the LLRM is performing well for these watersheds.
The results of the models indicate that in order to prevent increasing phosphorus levels in the lake, measures and actions should focus on limiting the phosphorus load coming from developed areas. Land use categories included within the ‘developed’ or urban land use are: commercial, industrial, roads, multi and single family residential, and mowed fields. Within the urban land use, single family residential and roads were the main sources of phosphorus. Roads are a large source of P due to the fact that they represent impervious areas which carry untreated stormwater from land surfaces to storm drains and catch basins that empty directly into associated waterbodies.
Natural Background Conditions Return to Top
In order for residents, municipal officials, and other stakeholders to make informed decisions regarding protecting lake quality and to understand how development has impacted current water quality, the natural background condition, i.e. what the in-lake concentration of TP might have been before European settlement or pre-development, needs to be determined. To estimate in-lake P concentrations for both Lake Waukewan and Lake Winona, all land cover in the model was set to 100% forested land.
The estimated watershed TP load for Lake Waukewan decreased from 215.3 kg/year to 83.8 kg/year, a 61% decrease, resulting in a predicted in-lake TP concentration of 2.82 µg/L in Lake Waukewan. For Lake Winona, the watershed portion of the total load decreased from 78.2 kg/year to 36.0 kg/year, resulting in a predicted in-lake TP concentration of 3.28 µg/L. The other estimated direct sources of loading to the lakes (atmospheric, internal, waterfowl) were not changed, except for the septic system loading, which was eliminated.
Future Land Use Projections: Build-out Analysis Return to Top

Development constraints in the Waukewan watershed.
“Build-out†is a theoretical condition that represents the period when all available land suitable for residential, commercial, and industrial construction has been developed to the maximum conditions permitted by local ordinances.  A build-out analysis is a planning tool which identifies areas with development potential and projects future development based on a set of conditions (e.g., zoning regulations) and assumptions (e.g., population growth rate).  A build-out analysis was conducted by FB Environmental for the Lake Waukewan watershed, which consists of portions of the towns of Ashland, Center Harbor, Holderness, Meredith, and New Hampton.  However, the study area for the build-out includes only Center Harbor, Meredith, and New Hampton, as data required to extend the analysis within Holderness were not obtained and the vast majority of Ashland within the Waukewan watershed is conserved and/or unbuildable.  The analysis was conducted using CommunityViz version 4.3, an extension program for ArcMap Geographic Information System (GIS) software.
To determine where development could potentially occur in the study area, build-out calculations deduct land with physical constraints to development including environmental restrictions (e.g. hydric soils, steep slopes, wetlands), zoning restrictions (e.g. minimum lot size and building setbacks), and practical design considerations (e.g. lot layout inefficiencies). Â Existing buildings also reduce the available capacity for new development.
The build-out analysis classified 2,729/5,540 acres (49 %) of the land within the watershed as buildable, with the majority of the land located in rural and agricultural zones in Center Harbor and New Hampton.  Of the 2,729 acres, 1,556 acres (57%) are on vacant land (i.e., parcels with no currently existing structures). An additional 769 buildings could be constructed in the future, resulting in a total of 1,693 buildings within the study area. Of the total 769 projected buildings, 548 (71%) were placed on land that is currently vacant.

Buildable area by zone for portions of Center Harbor, Meredith, and New Hampton, within the Lake Waukewan watershed.
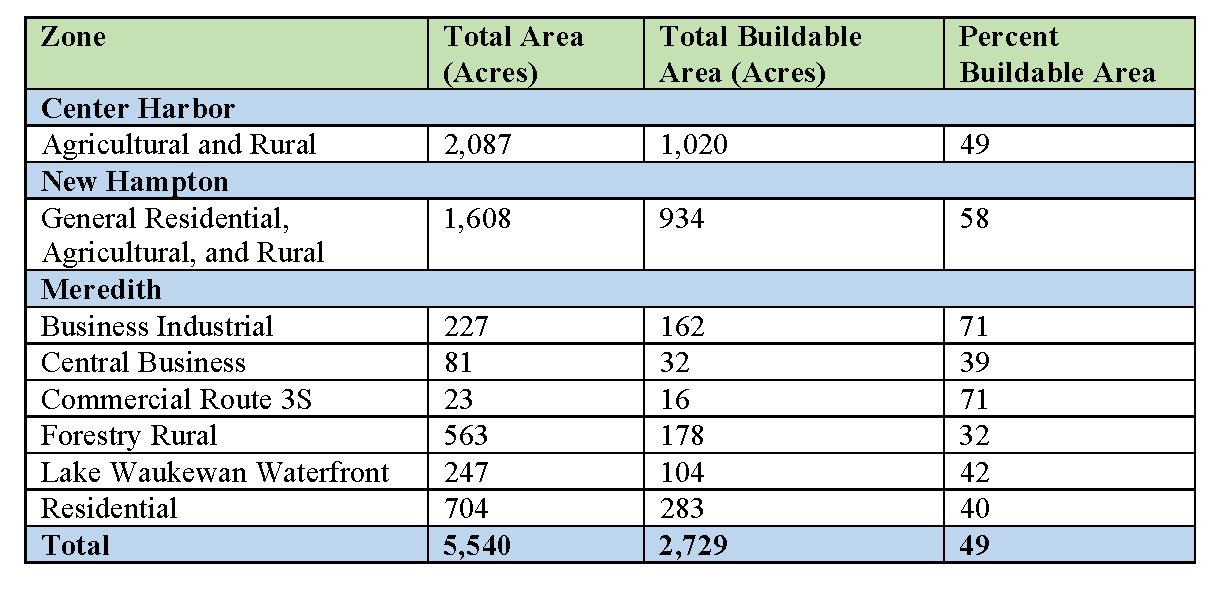
Buildable area by zone for portions of Center Harbor, Meredith, and New Hampton, within the Lake Waukewan watershed.

Existing and projected buildings for portions of Center Harbor, Meredith, and New Hampton, within the Lake Waukewan watershed
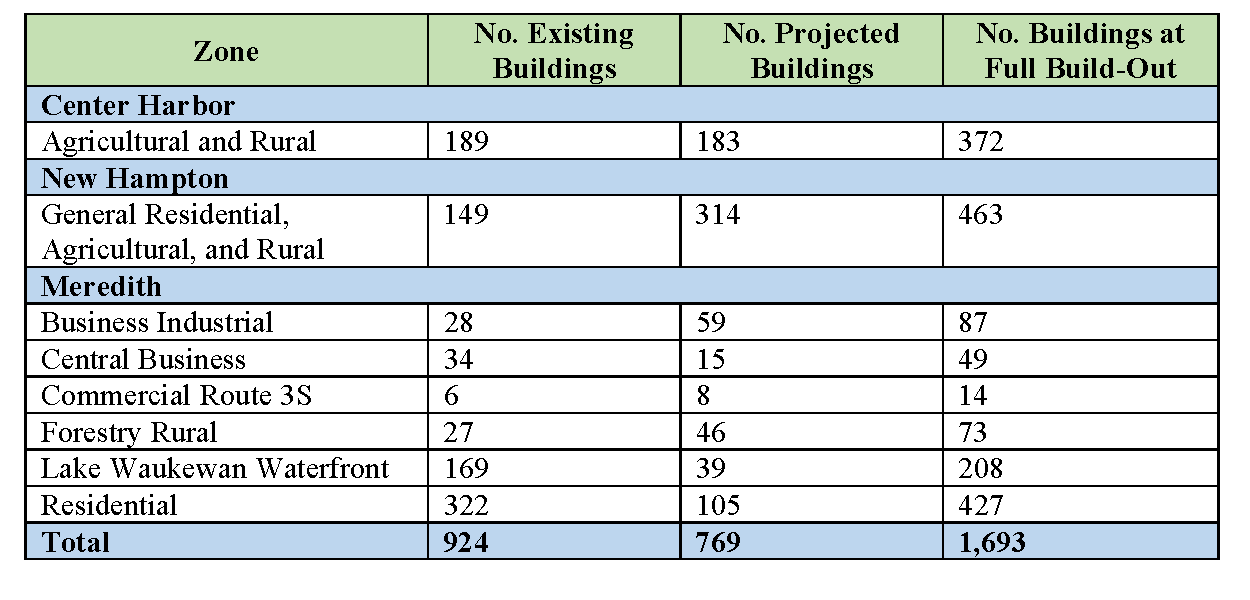
Existing and projected buildings for portions of Center Harbor, Meredith, and New Hampton, within the Lake Waukewan watershed.
CommunityViz’s TimeScope tool is used to look at changes in the amount of development within a given area over time. The tool assigns a “build date†to features within a layer based on a specific set of rules including (most importantly) population growth rate and building sequence type (e.g., random or near roads).
Examination of data obtained from the US Census Bureau shows that the towns within the study area have experienced steady population growth since the middle of the last century. Since 1960, the populations of Center Harbor, Meredith, and New Hampton have increased 114%, 156%, and 151%, respectively. The 10-year (2000-2010) compound annual growth rate (CAGR) for the three towns is 0.67%, the 20-year (1990-2010) CAGR is 1.23%, and the 30-year (1980-2010) CAGR is 1.17%. These figures were used for three iterations of the TimeScope analysis. Full build-out is achieved in 2111, 2066, and 2069 for the 10-, 20-, and 30-year CAGR’s, respectively.
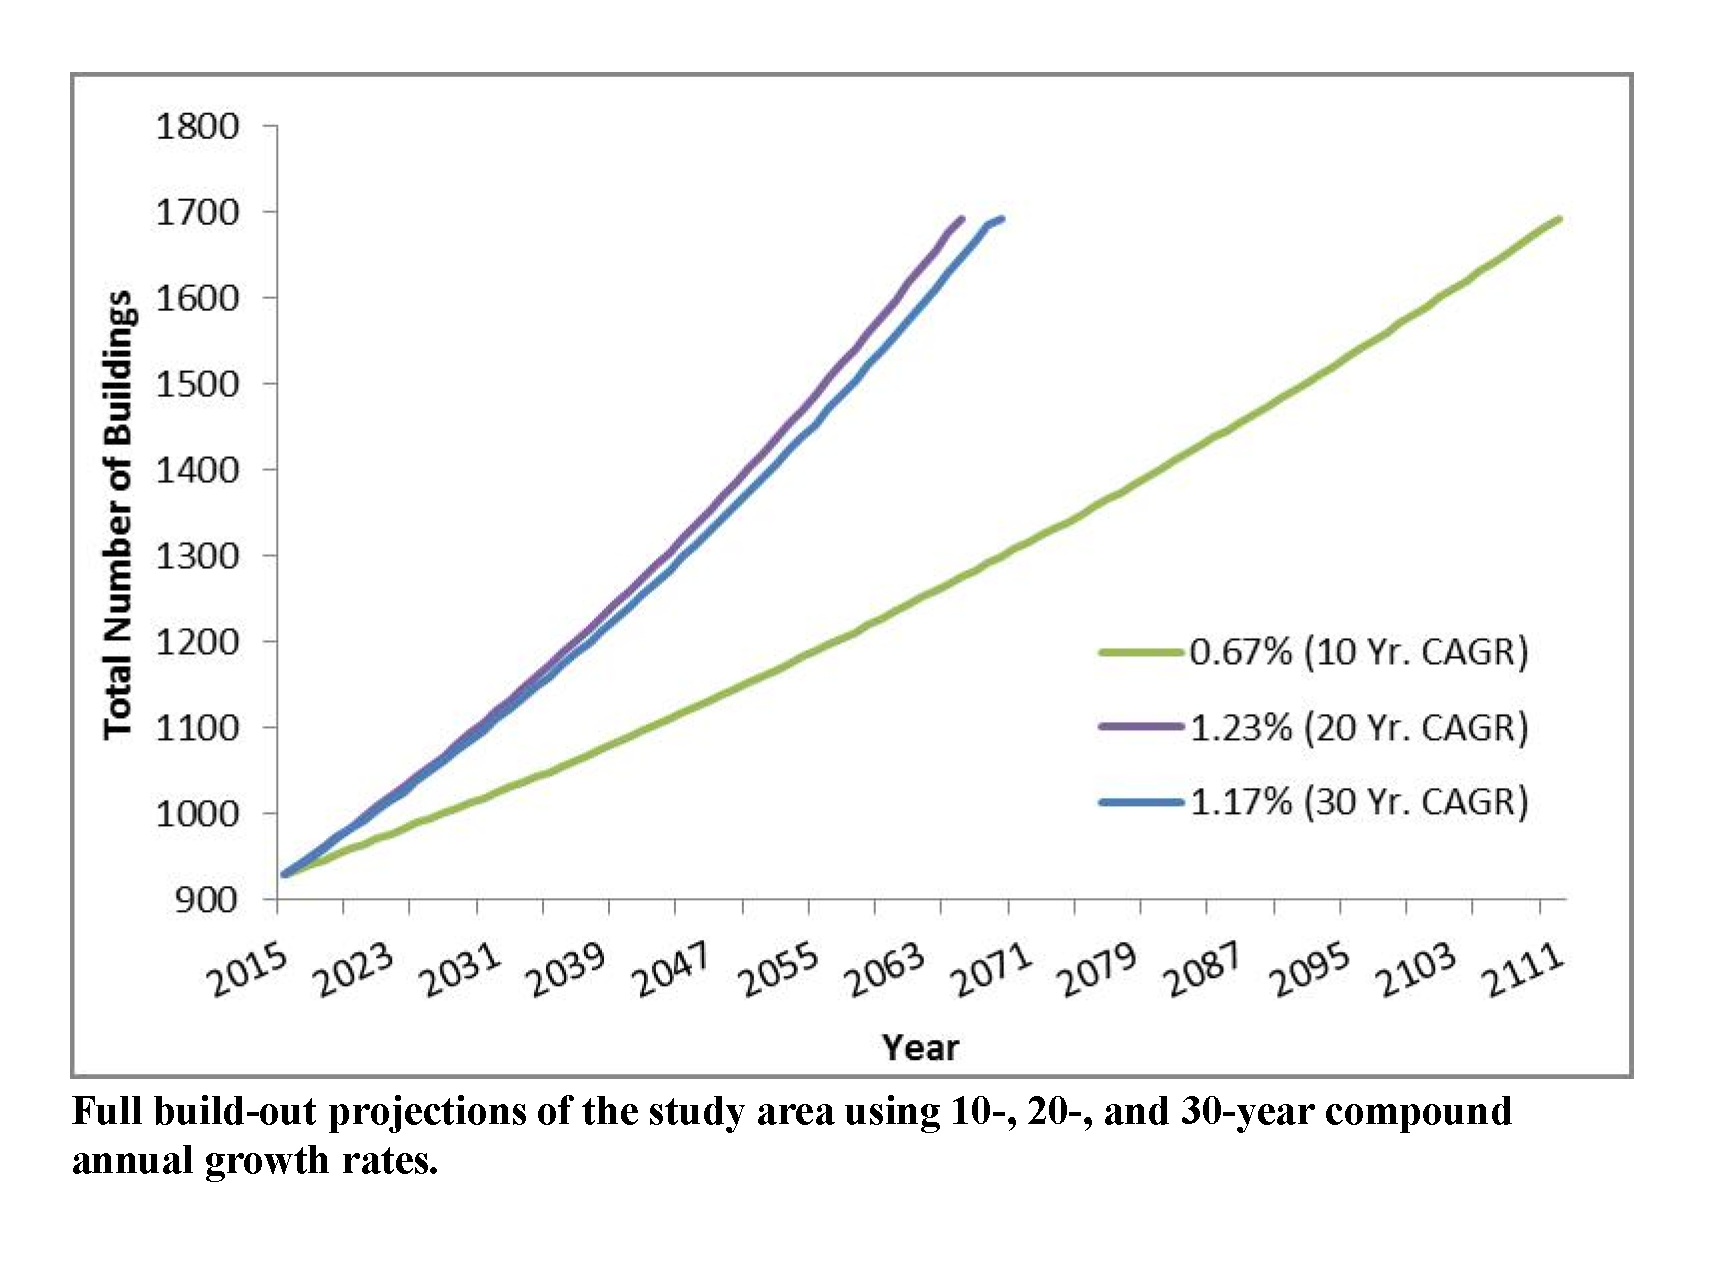
Note that the dates provided here are estimates only; numerous factors including the amount of land in current use designation and the status of the economy may affect the rate of development.
An increase in watershed development could lead to more phosphorus (P) entering Lakes Winona and Waukewan from the surrounding watershed each year. The Lake Loading Response Model (LLRM) was used to estimate the additional annual phosphorus load that could result from full build-out in the watershed.
For current conditions in Lake Waukewan, the LLRM predicted 5.9 µg/L total phosphorus concentration, which is close to the empirical value (mid-summer epilimnetic median at both north and south deep spots) of 5.6 µg/L. The modeled phosphorus mass load was 306.5 kg/year, with 215.3 kg/year coming from the watershed (including Lake Winona), 28.3 kg/year coming from septic systems, and the remainder from atmospheric deposition, internal loading, and waterfowl.
Under the full build-out scenario for the Lake Waukewan watershed (including Lake Winona), the in-lake phosphorus concentration under build-out conditions would increase 36% to 8.0 µg/L. The P load from runoff would increase 42% to 304.8 kg/year, and loading from septic systems would increase 71% to 48.4 kg/year.
Lake Winona was modeled as a distinct subwatershed.  For current conditions, the LLRM predicted an in-lake total phosphorus concentration of 7.2 µg/L, close to the composite empirical data point (10-year summer median concentration at Snake River and Winona Outlet/Waukewan Inlet) of 7.3 µg/L.  The phosphorus mass load modeled by LLRM was 103 kg/year.  Of this P load, 78 kg/year came from runoff, 13.6 kg/year came from septic systems, and the remainder from atmospheric deposition and waterfowl.
Viewed as a separate watershed, Lake Winona would see an increase in P concentration of 48% to 10.6 µg/L.  P loading from watershed sources would rise 35% to 105.9 kg/year, and septic systems would contribute 156% more at 34.9 kg/year.
Although the build-out analysis would indicate that both Lake Winona and Lake Waukewan would still meet the water quality criterion for P for their trophic classification at full build-out, both lakes are currently impaired for dissolved oxygen, as well as a cyanobacteria impairment for Lake Waukewan, indicating that future loading would likely lead to greater impairment.
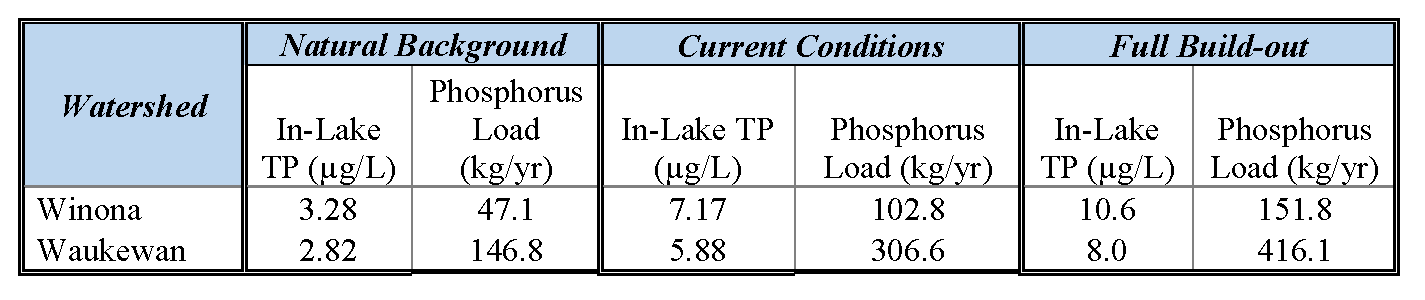
Comparison of phosphorus loading and in-lake response under various development scenarios
Selecting a Water Quality Goal Return to Top
Lake quality is impacted by the amount of pollutants that enter the waterbody. Pollutants are delivered in several ways; through atmospheric deposition (rainfall), groundwater, point sources, watershed loading (land use), streambank and lakeshore erosion, septic systems, and internal loading. Because many of the pollutants contribute oxygen-demanding organic matter, and nutrients that stimulate the growth of organic matter, pollutants cause a decrease in average dissolved oxygen (DO) concentrations. If the organic matter is formed in the lake, for example by algal growth, at least some of the oxygen produced during growth will offset the eventual loss of oxygen during decomposition. However, in lakes where a large portion of the organic matter is brought in from outside the lake, oxygen production and oxygen consumption are not balanced and low DO may become even more of a problem.
Dissolved Oxygen and Lakes:Â excerpted from the Michigan Inland Lakes Partnership
The amount of dissolved oxygen in the water is an important indicator of overall lake health. In the summer most lakes with sufficient depth (greater than 30 feet) are stratified into three distinct layers of different temperatures. These layers are referred to as the epilimnion (warm surface waters) and hypolimnion (cold bottom waters) which are separated by the metalimnion, or thermocline layer, a stratum of rapidly changing temperature. The physical and chemical changes within these layers influence the cycling of nutrients and other elements within the lake.
During summer stratification the thermocline prevents dissolved oxygen produced by plant photosynthesis in the warm waters of the well-lit epilimnion from reaching the cold dark hypolimnion waters. The hypolimnion only has the dissolved oxygen it acquired during the short two-week spring overturn. This finite oxygen supply is gradually used by the bacteria in the water to decompose the dead plant and animal organic matter that rains down into the hypolimnion from the epilimnion, where it is produced. With no opportunity for re-supply the dissolved oxygen in the hypolimnion waters is gradually exhausted. The greater the supply of organic matter from the epilimnion and the smaller the volume of water in the hypolimnion the more rapid the oxygen depletion in the hypolimnion. Highly productive eutrophic lakes with small hypolimnetic volumes can lose their dissolved oxygen in a matter of a few weeks after spring overturn ends and summer stratification begins. Conversely, low productive oligotrophic lakes with large hypolimnetic volumes can retain high oxygen levels all summer.
When a lake’s hypolimnion dissolved oxygen supply is depleted, significant changes occur in the lake. Fish species that require cold water and high dissolved oxygen levels are not able to survive. With no dissolved oxygen in the water the chemistry of the bottom sediments is changed resulting in the release of the nutrient phosphorus into the water from the sediments.  As a result, the phosphorus concentrations in the hypolimnion of productive lakes can reach extremely high levels. During major summer storms or at fall overturn, this phosphorus can be mixed into the surface waters to produce nuisance algae blooms.
As phosphorus is the limiting nutrient of concern for NH’s freshwater lakes, preventing or limiting increases in phosphorus loading to both Lake Waukewan and Lake Winona is critical for addressing the dissolved oxygen impairment and for protecting lake health.
Setting a water quality goal for total phosphorus is of central importance to the Plan because it will dictate the level and scope of watershed restoration efforts necessary to reduce phosphorus loads by the determined amount.
A local water quality goal for phosphorus for Lake Waukewan and Lake Winona should either meet or exceed the State Standard in order to protect the health of the waterbody and Lake Winnipesaukee for the long term. In general, local water quality goals may be set to:
- result in no increase in in-lake TP concentration,
- no increase that would violate state water quality criteria,
- attain a decrease in existing in-lake TP levels.
To guide the Waukewan Winona Lake Study Advisory Committee in choosing water quality targets for Lakes Waukewan and Winona, staff from LWA, FB Environmental Associates, DK Water Resource Consulting and NHDES reviewed the water quality data, assimilative capacity and pollutant loading analyses.
NH lakes have a greater Chl-a response to TP loadings than many other lakes due to their excellent water clarity. As the in-lake TP concentration nears 8-10 µg/L, an increased response in cyanobacteria is often seen. Because of this low tipping point for many NH lakes (8-10 µg/L threshold), it is important to prevent increases in in-lake TP concentrations as it may not be possible to return to lower levels (J. Schloss, personal communication, August 8, 2013).
Evaluation of options for selection of a WQ goal
The ability to run various scenarios that will predict in-lake response to nutrient load is important to the setting of the local water quality goal. FB Environmental Associates used the Lake Loading Response Model (LLRM) to predict in-lake phosphorus and chlorophyll-a for each lake based on estimates of current nutrient loading. Predictions of in-lake phosphorus and chlorophyll-a are important to the loading model because they allow for calibration of model inputs. Values predicted in the LLRM are compared to actual field data to ensure the accuracy of data used to build the model, and the validity of the results that the model provides.

Three possible water quality goals are presented in the table below. The first goal is set to attain the in-lake phosphorus value that is the threshold for each lake’s trophic class, as designated by NHDES. Lake Waukewan is currently designated as Oligotrophic, and Lake Winona as Mesotrophic. The corresponding TP concentrations for these designations (8.0 and 12.0 µg/L, respectively) are used in the calculations below. Although Lake Winona’s TP is within the Oligotrophic threshold for NH lakes, several parameters are considered to determine trophic class, including summer bottom Dissolved Oxygen, Secchi disk transparency, aquatic vascular plant abundance, and summer epilimnetic Chl-a.
The second scenario uses a goal of the NHDES threshold minus 10% of that value, in order to provide the lake with reserve assimilative capacity that will keep it below the threshold, accounting for year to year variation. The third goal uses a target value of predicted in-lake phosphorus concentrations minus 10% of that value, in order to set water quality goals that will quantify reductions in phosphorus loading to the lakes.
Since both lakes have current phosphorus concentrations below the NHDES thresholds, the “Change in P loading†values for these goals are expressed as a positive percentage value. These values represent an allowable increase in phosphorus loading before the threshold target is reached. In the third scenario (Predicted concentration – 10%), the percent change is expressed as a negative number, indicating the amount of decreased phosphorus load necessary to meet the target concentrations.

The above information was presented to the Waukewan Winona Lake Study Advisory Committee (WWLSAC) on October 27, 2014. Representatives for both Lake Waukewan and Lake Winona opted to select target goals which decrease the in-lake phosphorus concentration from the predicted in-lake levels. The target goal for Lake Waukewan was set to achieve an in-lake TP concentration of 5.3 µg/L in 10 years, requiring a reduction in phosphorus load to the lake of 31 kg/year. Although Lake Winona is well below the reserve assimilative capacity threshold of 10.8 µg/L for a mesotrophic waterbody, the WWLSAC chose to be aggressively proactive and selected a target goal to achieve a 5-10% decrease in in-lake TP concentration in 10 years.Â
