Issues of Concern
Erosion, sedimentation, stormwater, phosphorus and land use are among the major issues facing the Winnipesaukee watershed.
- Introduction
- Identifying the Issues
- Land Use and Phosphorus Loading
- Results of the Model
- Results by Subwatershed
Introduction Return to Top
Lake Winnipesaukee and its surrounding watershed are part of a healthy, dynamic ecosystem, which is influenced by a diverse range of human activity and land use.  The need to balance land use with protection of the water quality of the lake requires that we manage landscape change and human activity in a sustainable manner.
What does that mean, in practical terms?
Landscape change and human activity cause more pollutant load to the lake unless best management practices are put in place and maintained to minimize impacts.
Sustainability is obtained when human activity in the lake watershed is managed so that eutrophication occurs at no greater a rate than natural eutrophication.
So what activities and landscape changes are causing or resulting in increased loads of pollutants (mainly phosphorus)Â to Meredith, Paugus, and Saunders Bays?
Identifying the Issues Return to Top
In order to begin discussing issues and concerns, each community was asked to complete a worksheet about its current knowledge of impairments, available data, threats to future conditions, and specific concerns within their community. A Nonpoint Source Issues Table (PDF, 27kb) was compiled for the group to use as reference; each community’s response can be found in the appendices under “Community Worksheets”.
Three issues common to all were septic system management, erosion and sediment control, and stormwater management. The Meredith, Paugus, Saunders Bays Subwatershed Committee spent several meetings developing a matrix detailing each community’s current strategies, improvements and/or recommended strategies, and available supporting data or information regarding the issue of concern.
Here is what they found:
1. Septic Systems Return to Top
Failing septic systems are a major threat to water quality due to the leaching of nutrients and pathogens (bacteria) into ground and surface waters. Identification of substandard and failing systems along with proper maintenance of functioning septic systems are goals of each community. Read the Septic Systems Strategies document here (PDF, 116kb)

Click for a larger map of the Winnipesaukee River Basin Sewer Program Service Area
Septic systems are of greatest concern for the communities of Meredith and Gilford, as approximately 80% of each community relies on private wastewater treatment systems; whereas in Laconia, 75% of the town is on municipal water and sewer.
Several key points and action items were determined by the committee:
- The need for up to date data (GIS data layer) as to which lots are on sewer. The general areas of town that have sewer lines are known, but not all property owners are necessarily connected to it.
- A septic system use and maintenance education program for property owners is needed. In addition, property owners who receive bills from the water and sewer department assume they are on sewer, when in actuality they may only be on water.
- Tracking and management of septic systems is needed in each community
2. Erosion and Sedimentation Return to Top
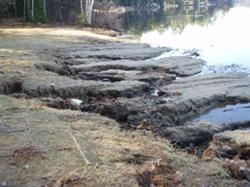
 Erosion and sedimentation are natural processes, but can be accelerated when land is disturbed during development, forestry, agricultural and mining activities. Erosion can result in the release of soil nutrients that may result in algal blooms, aquatic plant proliferation and accelerate eutrophication. Eroded soil suspended in water and deposited, can destroy plant and animal habitat and degrade water quality. Erosion and sedimentation affects the flood control ability of streams, and lakes by decreasing the volume capacity. Read the full report here (PDF 123kb).
Due to the high level of development activity that has occurred in each community over the last decade, the amount of “good†buildable land has decreased, leaving available mainly marginal land. This presents greater planning challenges for communities due to slope, steepness, and wetland considerations.
The main concerns and issues regarding erosion and sedimentation controls determined by the committee include:
- Erosion and sediment controls need to be integrated with Storm water management regulations and controls.
- In Gilford the E &S Control Plan comes under the Site Plan and Subdivision Regulations and should be made into a zoning ordinance
- Need to include low impact development techniques (LID) into Zoning and Regulations
- Consider different temporary versus permanent erosion controls (in Meredith, the current ordinance does not differentiate).
- Require formal construction agreements that specify sequencing, inspections, and reports, for both temporary and permanent controls.
3. Stormwater Management Return to Top
How and if water runs off from its source (whether rain or snow) is a critical issue for the lake. The conversion of natural ground cover to developed land affects the infiltration of precipitation and snow melt. As land is made more impervious the amount, velocity and duration of runoff increase. Impervious cover as parking lots and roadways often contain pollutants. Fertilizers and pesticides applied to land of vegetated cover can migrate off site with runoff. Learn more about the communities current stormwater strategies here (PDF, 121kb).
In general, stormwater runoff from polluted sources should be treated for removal of the pollutants before moving far from its source. Stormwater runoff should also be controlled to as close to pre-conversion conditions as possible to minimize erosion and flooding.
Discussions highlighted key issues among communities:
- Mapping of catch basins, culverts and stormwater discharge points is needed
- Definition of imperviousness or impervious surface needs to be clarified
- Laconia zoning is based on “% green space required” rather than “maximum % impervious cover allowed”
- Stormwater regulations need to be integrated with Erosion and Sediment Control Regulations
- Adopt stronger provisions for stream and wetland buffers in the towns’ ordinances.
- Estimates of current and future impervious cover data is needed for communities to make better informed planning decisions
- A review of limits of impervious cover by zone is needed as the minimum amount of impervious cover allowed is 25% and impairments begin to be seen between 10-20% imperviousness
Land Use and Phosphorus Loading Return to Top
 Having identified the issues of concern in the watershed, the communities need to know the relative contribution or pollutant load from each land based activity. In other words, “How much do we P now?”
How do we quantify the pollutant loads coming from the lands of the watershed?
The phosphorus loading for each subwatershed was estimated using EPA’s STEPL model (Spreadsheet Tool for Estimating Pollutant Load), based on local land use data. The STEPL model estimates pollutant load based on land use characteristics, rainfall and runoff data, and hydrologic soil type. The following table shows the 2009 Land Use-Land Cover (based on 2006 and 2008 aerial photography) used in the STEPL analysis:
| Lake Waukewan | Meredith Bay | Paugus Bay | Saunders Bay North | Saunders Bay South | |
|---|---|---|---|---|---|
| Urban | 951.1 | 1,799.0 | 1,858.0 | 524.0 | 2,229.0 |
| Agriculture | 196.3 | 204.7 | 276.9 | 51.2 | 476.0 |
| Forested | 6,014.0 | 4,180.0 | 4,096.5 | 2,431.0 | 6,663.0 |
| Water | 1,247.9 | 2,618.6 | 1,293.4 | 1,777.0 | 3,336.0 |
The following chart shows the percentage of phosphorus load for the entire study area, based on the 2009 land use data and using the STEPL model (note – the water category is not included in the calculation of pollutant load):Â
2009 Estimated Total P Load by Land Use in the MPSB Subwatersheds (including Waukewan)
 In the Waukewan, Meredith, Paugus, and Saunders Bays subwatersheds, 17% of the land use is urban, but contributes 92% of the phosphorus load, compared to 55% forested land use contributing 4% of the phosphorus load. The land use and phosphorus load breakdown for each subwatershed is shown below.

Phosphorus Load (click for a larger image)
Results of the model Return to Top
The results of the models indicate that in order to prevent increasing phosphorus levels in the lake, measures and actions should focus on limiting the phosphorus load coming from urban areas.
Urban areas include all these land use categories: commercial, industrial, institutional, transportation, multi and single family residential, urban cultivated, vacant land, and open space. Within the urban land use, the transportation category (road network) and single family residential were the main sources of phosphorus. The transportation category is a large source of P due to the fact that it represents impervious areas and carries untreated stormwater from land surfaces to storm drains and catch basins that empty directly into associated waterbodies.
The chart below breaks down the Urban Land Use category by the distribution of classes that make up the category. Within Urban Land Use, Transportation (road network), followed, in most cases, by Single Family Residential are the largest sources of phosphorus.

Results by Subwatershed Return to Top
Waukewan Watershed:Â Â Total estimated phosphorus load for the Waukewan watershed is 834 lbs per year. The major source for the phosphorus is from the Urban land use category. Although urban land accounts for only 11% of the total watershed acreage, it contributes 88% of the phosphorus load.
Meredith Bay:Â The estimated phosphorus loading for the Meredith Bay watershed is 1524 lbs per year. The Urban land use category is the major source of the phosphorus loading with an estimated 1437 lbs. Although the Urban land use category only makes up 20% of the total land use, it accounts for 94% of the phosphorus load.
Paugus Bay: As was shown in the previous subwatersheds, urban land use is the major source or contributor of phosphorus in the watershed.  In the Paugus Bay subwatershed, the transportation land use makes up 16% of the urban land use category, but contributes 58% of the phosphorus. Out of the four subwatershed areas, Paugus Bay has the most commercial, industrial, and urban cultivated land, accounting for 35% of the urban category.
Saunders Bay:Â Â Â The Saunders Bay subwatershed was first evaluated as a whole to determine the phosphorus loading by land use. The watershed was then split into two sections based on GIS digitizing and estimated flow paths. These delineations are somewhat arbitrary as unlike land topography, lines cannot be drawn through water to separate basin areas.
Saunders Bay North lies in the community of Meredith, on Meredith Neck. The total estimated phosphorus load for Saunders Bay North was 331 lbs per year, the lowest loading of the subwatersheds; however it represents a small subwatershed area, relatively undeveloped.
The majority of land in the Saunders Bay South subwatershed lies in the community of Gilford. Seventeen percent (17%) of the land use falls in the Urban category contributing 1636 lbs of phosphorus annually, while 53% forested land contributes only 79 lbs of phosphorus.
