Watershed Characterization
Moultonborough Bay Inlet (MBI) comprises the northernmost feature of Lake Winnipesaukee with a watershed area of 32,246 acres that extends through Moultonborough up into Sandwich.
2.1 LOCATION AND CLIMATEÂ Return to Top
Located in the Lakes Region of east central New Hampshire just south of the White Mountains, Moultonborough Bay Inlet (MBI) has been long treasured as a recreational haven for summer vacationers and year-round residents. The 50 square-mile (32,246-acre) watershed hosts some of the oldest summer vacation spots in New Hampshire and offers fishing, hiking, boating, sailing, canoeing, kayaking, and swimming in the summer, and ice fishing, cross-country skiing, and snowmobiling in the winter. The watershed is spread across three towns, with 68% (21,861 acres) in Moultonborough, 32% (10,380 acres) in Sandwich, and <1% (5 acres) in Tamworth.
MBI is situated within a temperate zone of converging weather patterns from the hot, wet southern regions and the cold, dry northern regions, which causes various natural phenomena such as severe thunder and lightning storms, hurricanes, and heavy snowfalls. The area experiences moderate to high rainfall and snowfall, averaging 51.7 inches of precipitation annually (data collected from 1981-2010 at the Tamworth, NH weather station; NOAA NCDC, 2016). Temperature generally ranges from 10 °F to 58 °F with an average of 21.5 °F in winter and 65.1 °F in summer (NCDC, 2016).
2.2. POPULATION, GROWTH TRENDS, AND LAND COVER Â Â Return to Top
2.2.1. Population and Growth Trends
Many lakeshore residents in the MBI watershed are seasonal and enjoy the natural beauty of the landscape from Independence Day to Labor Day. These seasonal residents and visitors utilize various property types around the lakeshore, including private camps, private rental camps, group rental cottages, family resorts, children’s camps, and overnight cabins.

Development in the watershed changes the natural land cover that protects lake water quality. All new development should be managed carefully to mimic natural conditions by infiltrating stormwater runoff during storm events. (Photo: FB Environmental)
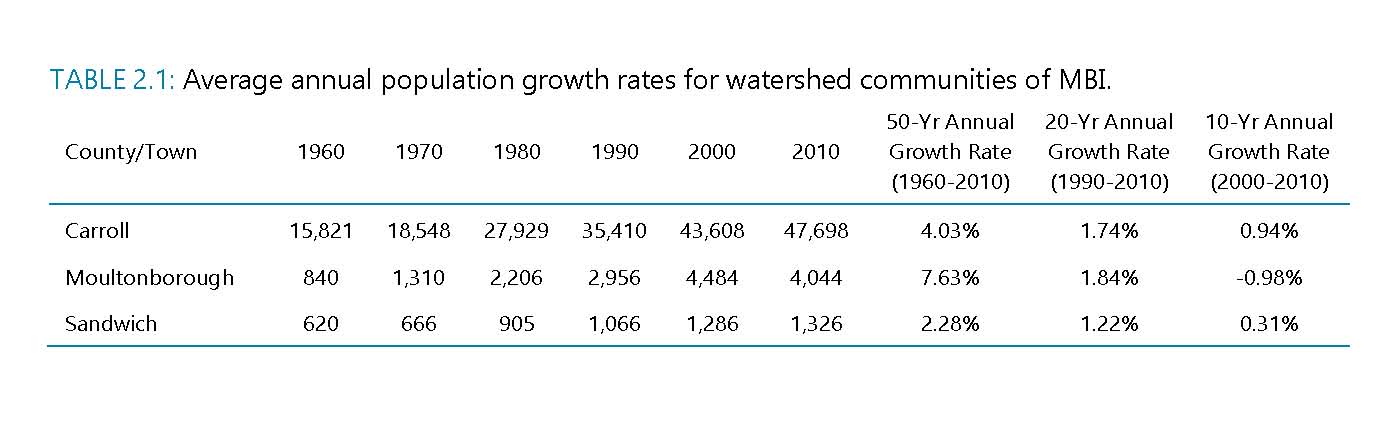
Understanding population growth and demographics, and ultimately development patterns, provides critical insight to watershed management, particularly as it pertains to lake water quality. According to the U.S. Census Bureau, the population of Carroll County in 2010 was 47,698, representing a 9.4% increase in population since the 2000 census (NHOEP, 2011). There is limited public transportation in the area, and most people use personal vehicles in their daily commute. Residents are attracted to the MBI watershed for its small-town character and easy commute by vacationers in northern and southern New England.
From 2000 to 2010, the population of Moultonborough decreased by 9.8% and the population of Sandwich increased by 3.1% (NHOEP, 2011; Table 2.1). Historically, Moultonborough experienced more rapid annual growth rate than the rest of the county up until 2000 when its annual growth rate slowed and declined, nearly equaling the positive growth rate experienced by the rest of the county. Sandwich has experienced slow, but steady growth in population compared to the rest of the county.
Most the population for the watershed towns fall within the 20-64 age category. Residences in these watershed towns comprise a high percentage of seasonal (35-61%) and owner-occupied (86%) homes (Table 2.2). These statistics illustrate the well-known fact that the Lakes Region is an attractive tourist destination for those seeking a tranquil summer retreat, particularly along the shores of MBI. Interestingly, however, Moultonborough has a relatively low percentage of total occupied homes (35%) compared to the State and county, suggesting a significant portion of buildings in the town are vacant or non-livable structures.

The desirability of MBI as a recreational destination will likely stimulate a return of positive population growth in the future for the Town of Moultonborough. Therefore, communities within the watershed should consider the effects of current municipal land-use regulations on local water resources. As the region’s watersheds are developed, erosion from disturbed areas increases the potential for water quality decline.
2.2.2. Land Cover
Characterizing land cover within a watershed on a spatial scale can highlight potential sources of NPS pollution that would otherwise go unnoticed in a field survey of the watershed. For instance, a watershed with large areas of developed land and minimal forestland will likely be more at risk for NPS pollution than a watershed with well-managed development and large tracts of undisturbed forest, particularly along headwater streams.

Land cover within the MBI watershed is dominated by forest (see Appendix B for larger map).
Today, development accounts for 10% of the watershed, while forested areas dominate at 75% (Figure 2.1). Wetlands and open water (including the surface area of MBI) represent 2% and 10% of the watershed, respectively. Agriculture represents 3%, and includes row crops, grazing pastures, and hayfields. Development, while a relatively low percentage at the watershed-scale, is concentrated around waterbodies, particularly MBI, and consists of a mix of seasonal and year-round residential homes, including numerous old cottages and summer camps and two densely-built residential communities of approximately 400 homes located along the southeastern shore of the Inlet (e.g., Suissevale and Balmoral). Crystal Geiser Bottling Plant is located off Route 171 at Castle in the Clouds. There are also numerous livestock farms (e.g., Keyser Farm, Castle in the Clouds, Mt. Breeze Farm) that host a variety of animals, including horse, cattle, goat, and sheep.
Developed areas within the MBI watershed are characterized by impervious surfaces, including areas with asphalt, concrete, and rooftops that force rain and snow – that would otherwise soak into the ground – to runoff as stormwater. Stormwater runoff carries pollutants to waterbodies that may be harmful to aquatic life, including sediments, nutrients, pathogens, pesticides, hydrocarbons, and metals. Studies have shown a link between the amount of impervious area in a watershed and water quality conditions (CWP, 2003).

Figure 2.1 Land Cover in the MBI Watershed.
In one study, researchers correlated the amount of pollutants in a waterbody to the percentage of land with impervious cover in a watershed (Mallin et al., 2000). Therefore, the water quality of the Inlet is impacted by and reflective of the amount of developed area in the watershed. As population grows, it is imperative that watershed communities incorporate LID techniques into new development projects. More information on LID and BMP implementation can be found in the Action Plan in Section 5.2.
2.2.3. Protected and Public Lands
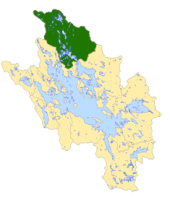
Land conservation is essential to the health of a region, particularly for the protection of water resources, enhancement of recreation opportunities, vitality of local economies, and preservation of wildlife habitat. Considerable effort by watershed towns and private individuals has gone into the protection of land in the MBI watershed not only to protect critical wildlife habitat and other environmentally-sensitive land and water resources, but also to provide low-impact, public recreational access to these natural resources. Land conservation is one of many tools for protecting lake water quality for future generations. Conservation land in the MBI watershed covers 14.2 square miles (9,113 acres) or approximately 29% of the watershed, and includes a mix of conservation easements (5%), deed restrictions (6%), and fee ownerships (18%).

Conservation land covers 29% of the watershed of MBI (see Appendix B for larger map).
2.3 PHYSICAL FEATURES Return to Top
2.3.1 Topography
MBI exists at about 500 feet above sea level (fasl) and is encompassed by mountainous woodlands in all directions. The highest peaks in the watershed are located to the east in the Ossipee Mountains at 2,782 fasl (e.g., Faraway Mountain, Mt. Roberts, and Black Snout Mountain), to the north near Dinsmore Pond at 1,606 fasl, and to the west in the Red Hills at 2,030 fasl.
2.3.2Â Soils and Geology
The composition of soils surrounding MBI reflects the dynamic geological processes that have shaped the landscape over millions of years. Over 380 million years ago, the region was under a shallow sea from a sinking continent; layers of mineral deposition compressed to form sedimentary layers of shale, sandstone, and limestone known as the Littleton Formation (Goldthwait, 1968). The Earth’s crust folded under high heat and pressure to form metamorphic rock comprising the parent material – schist, quartzite, and gneiss. This parent material has since been modified by bursts of igneous rock intrusions known as the New Hampshire Plutonic Series (300 million years ago) and the White Mountain Plutonic Series (120 million years ago) (Goldthwait, 1968).
The current landscape formed 12,000 years ago at the end of the Great Ice Age as the mile-thick glacier over half of North America melted and retreated, scouring bed rock and depositing glacial till to create the deeply scoured basin of lakes. The retreating action also eroded nearby mountains composed of granite, quartz, gneiss, and schist, leaving behind remnants of drumlins and eskers from ancient stream deposits. The glacier deposited more than three feet of glacial till (mix of coarse sand, silt, and clay), laying the foundation for invading vegetation and meandering streams as the depression basins throughout the region began to fill with water (Goldthwait, 1968).
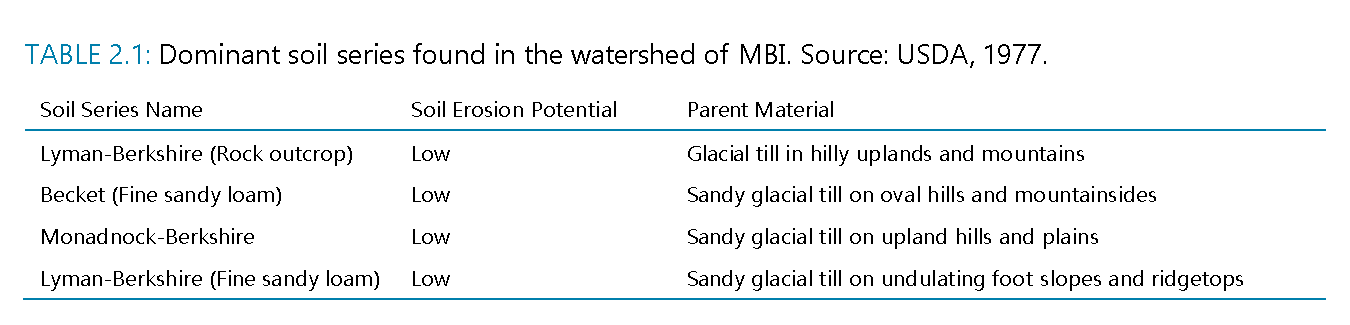
The MBI watershed is characterized by multiple soil series. Over 5,650 acres (18%) of the watershed is underlain by the Lyman-Berkshire rock outcrop complex; 4,651 acres (14%) is underlain by Becket fine sandy loam; 3,144 acres (10%) is underlain by Monadnock and Berkshire soils; and 3,070 acres (10%) is underlain by Lyman-Berkshire fine sandy loams (Table 2.3).
Other soil series present in the watershed (<5%) include: Skerry fine sandy loam (1,605 acres), Marlow fine sandy loam (1,467 acres), Peru fine sandy loam (1,077 acres), Woodstock-Bice fine sandy loam (969 acres), Pillsbury fine sandy loam (881 acres), Ossipee mucky peat (765 acres), Chocorua mucky peat (750 acres), Leicester-Moosilauke fine sandy loam (688 acres), Henniker fine sandy loam (671 acres), Waumbek fine sandy loam (603 acres), Gloucester fine sandy loam (564 acres), Colton gravelly loamy fine sand (487 acres), Metacomet fine sandy loam (411 acres), Limerick silt loam (336 acres), Bucksport mucky peat (312 acres), Raynham silt loam (289 acres), Whitman loam (285 acres), Duane fine sandy loam (267 acres), Boscawen gravelly loamy sand (221 acres), Naumburg loamy sand (217 acres), Paxton fine sandy loam (175 acres), Woodstock-Bice-Rock outcrop complex (173 acres), Champlain loamy sand (163 acres), Croghan loamy fine sand (160 acres), Henniker-Gloucester fine sandy loams (158 acres), Berkshire fine sandy loam (106 acres), pits/gravel (51 acres), Adams loamy sand (40 acres), Woodbridge fine sandy loam (37 acres), Nicholville silt loam (36 acres), Salmon very fine sandy loam (33 acres), Podunk fine sandy loam (28 acres), Bice fine sandy loam (20 acres), Acton fine sandy loam (17 acres), and Ondawa fine sandy loam (9 acres). Water covers the remaining 1,662 acres in the MBI watershed.

Moderate to high soil erosion potential areas cover 9% of the watershed (see Appendix B for larger map).
Soil erosion potential is dependent on a combination of factors, including land contours, climate conditions, soil texture, soil composition, permeability, and soil structure (O’Geen et al. 2006). Soil erosion potential should be a primary factor in determining the rate and placement of development within a watershed. The soil erosion potential for the MBI watershed was determined from the erosion factor K (whole soil) used in the Universal Soil Loss Equation (USLE) that predicts the rate of soil loss to sheet or rill erosion by water in units of tons per acre per year. These estimates, which range from 0.02-0.69, are based on percentage of silt, sand, and organic matter, as well as soil structure and saturated hydraulic conductivity (Ksat).
Low soil erosion potential areas comprise most of the watershed at 70%. Moderate to high soil erosion potential areas account for 9% of the watershed and are concentrated around MBI in the southwestern portion of the watershed where development is prominent. Development should be restricted in areas with highly erodible soils due to their inherent tendency to erode at a greater rate than what is considered tolerable soil loss. Since a highly erodible soil can have greater negative impact on water quality, more effort and investment is required to maintain its stability and function within the landscape, particularly from BMPs that protect steep slopes from development and/or prevent stormwater runoff from reaching water resources. Due to the concentration of moderate soil erosion potential areas around the direct shoreline of MBI, even greater actions and/or precautions should be taken to address erosion on existing and future development in those areas.
2.3.3 Wetlands, Streams, Open Water, and Riparian Habitat
MBI provides a plethora of critical water resources for the surrounding landscape, including 2,561 acres of wetlands, 1,595 acres of open water, and 174 miles of streams. The RIPARIAN HABITAT of these waterbodies is home to a diverse community of fish, birds, mammals, and plants that are dependent on clean water quality to flourish. Wetlands can maintain this necessary water quality by acting as a filter of nutrients and sediments from incoming stormwater runoff. Any decrease in the extent of wetlands because of development will limit this natural filtration and cause detrimental long-term effects on water quality and diversity of inhabiting species.

New Hampshire Fish & Game ranks habitat based on value to the state, biological region, and supporting landscape. According to this schema, a good portion (26%) of the MBI watershed is considered Tier 1 for highest ranked habitat in the State of New Hampshire. This area includes some of the major ponds, bays, and tributaries in the watershed, along with their contributing matrix forests, particularly in the higher elevation areas to the west and east. A smaller portion (10%) of the watershed, particularly hillslopes and wetlands, is considered Tier 2 for highest ranked habitat in the biological region. Tier 3 for supporting landscapes covers 28% of the watershed, particularly around Tier 1 and 2 habitats and around major wetland complexes. About 36% of the watershed is not classified as priority habitat. A map detailing priority habitats for conservation based on the NH Wildlife Action Plan can be found in Appendix B.
The MBI watershed is characterized primarily by mixed forest that includes both conifers (white pine, hemlock, larch, spruce, and juniper) and deciduous tree species (maple, birch, beech, ash, red oak, alder, and poplar). Fauna that enjoy these rich forested resources include land mammals (moose, deer, black bear, coyote, bobcats, fisher, fox, raccoon, weasel, porcupine, muskrat, mink, chipmunks, squirrels, and bats), water mammals (muskrat, otter, and beaver), land and water reptiles and amphibians (turtles, snakes, frogs, and salamanders), various insects, and birds (herons, loons, gulls, multiple species of ducks, wild turkeys, cormorants, bald eagles, and song birds).
Fish are an important natural resource for sustainable ecosystem food webs and provide recreational opportunities. New Hampshire Fish & Game report that most tributaries (e.g., Cook Brook, Trib 2 to Red Hill Brook, Weed Brook, Halfway Brook, and Shannon Brook) within the MBI watershed contain wild brook trout, an indicator of good stream health. In 2009, Cook Brook in the northwestern part of the watershed exhibited the highest density of wild brook trout at the Statewide level. Bridle Shiners have also been confirmed to exist in Garland and Lees Pond, as well as all upland ponds, including Berry, Red Hill, and Dinsmore Ponds.
2.3.4Â Lake Morphology and Bathymetry
The morphology (shape) and bathymetry (depth) of lakes are considered reliable predictors of water clarity and lake ecology. Large, deep lakes are typically clearer than small, shallow lakes as the differences in lake area, number and volume of upstream lakes, and flushing rate affect lake function and health.
The surface area of MBI is 1.6 square miles (1,011 acres) with mean depths of 9.8 ft. (3.0 m) for Basins 1 and 2 and 15.4 ft. (4.7 m) for Basin 3. A maximum depth of 81 ft. (24.7 m) was recorded in Basin 3 near the Little Ganzy monitoring station. There are 24.6 miles of shoreline and 17,048,456 cubic meters of water volume in MBI. The AREAL WATER LOAD is 3.8 m/yr for Basin 1, 4.7 m/yr for Basin 2, and 27.2 m/yr for Basin 3. Basins 1, 2, and 3 flush on average 1.2, 1.5, and 5.8 times each year, respectively. A map detailing bathymetry and monitoring sites can be found in Appendix B.
 Lake volume was calculated for the Inlet based on the most recent bathymetry data provided by NHDES; however, the data are very coarse. Obtaining more detailed bathymetry data would help improve the model. Using the hydrologic budget determined by the land use model, flushing rates were calculated for the basins.
2.3.5 Direct and Indirect Drainage Areas
The most significant drainage to MBI is the area draining through Lees Pond to Basin 3. Covering 18,048 acres or 56% of the MBI watershed, this area accounts for 55% of the water volume and 46% of the total phosphorus (TP) loading entering Basin 3 and includes Cook Brook, Creamery Brook, Dinsmore Pond, Direct Red Hill Brook Drainage, Garland Pond, Lees Pond, Little Pond, Montgomery Brook, Red Hill Pond, Skinner Brook, Stanton Brook, Trib 2 to Red Hill Brook, Weed Brook/Berry Pond, and Weed Brook/Trib. Refer to Appendix B for a map of the sub-basins.
Other major inlets to Basin 3 include Shannon Brook (18% water volume, 18% TP loading), Basin 3 Direct (4% water volume, 13% TP loading), Halfway Brook (7% water volume, 7% TP loading), Middle Brook (6% water volume, 7% TP loading), Trib 2 to Basin 3 (5% water volume, 6% TP loading), and Basin 2 (5% water volume, 3% TP loading).
These tributaries and the contributing land cover of their watersheds are important to the water quality of MBI. Watershed load (runoff and tributary flow) accounts for 97% of the water entering MBI (Basin 3), including 5% water volume coming from Basin 2, which makes the condition of the tributaries and their associated land covers critical to water quality. Additional inputs to MBI (Basin 3) are from rainfall (2%). The large volume of water entering this waterbody directly or indirectly via tributary streams makes phosphorus loading from these subwatersheds of major importance for lake management. High phosphorus inputs can result in nuisance algal blooms that damage the ecology and aesthetics of a waterbody. As a result, reducing phosphorus inputs to MBI from tributaries should be a high management priority. A detailed summary of the nutrient loading analysis for MBI is provided in Section 3.2.3.
2.4 INVASIVE PLANTS Return to Top
The introduction of non-indigenous invasive aquatic plant species to New Hampshire’s waterbodies has been on the rise. These invasive aquatic plants are responsible for habitat disruption, loss of native plant and animal communities, reduced property values, impaired fishing and degraded recreational experiences, and high control costs. Once established, invasive species are difficult and costly to remove.
In 2009, the Town of Moultonborough established the Milfoil Crisis Committee, charged with bringing the infestation of milfoil under control in the Inlet, ponds, and streams of the town. The Committee has encouraged a strong volunteer Weed Watcher program to inspect shorelines for and document evidence of invasive aquatic species. The Inlet is also supported by the Lake Host Program that provides courtesy boat inspections at public boat launches. The Milfoil Eradication Program is made possible through $200,000 in appropriated annual funds from the Town of Moultonborough and over 65 volunteers donating more than 3,000 hours each year to program activities. The program includes herbicidal treatment, mechanical suction harvesting (DASH units), and hand pulling techniques for milfoil treatment.
According to the 2015 Long Term Variable Milfoil Management Plan for Moultonborough, variable milfoil established in Moultonborough Bay in 1965 and has since established widespread, mature seed stocks of the invasive plant (NHDES, 2015a). Since 2010, the area from Green’s Basin to Deepwood Ledges/Hemlock Point in Moultonborough Bay has greatly reduced from >90% coverage to 40% coverage of milfoil. The Committee is also testing new ideas for milfoil treatment, including benthic barriers, curtain barriers, and mature plan vacuuming.
